


🩻 15 Stocks I’m Buying This Week in Anticipation of Trump’s Inauguration (You Haven’t Even Heard About Half of These Companies)
Each pick offers a strategic balance of risk-adjusted return potential


To Smart Investors,
TL;DR:
This is a 50% Trump-policy-based portfolio and 50% fundamentals, strong metrics, and common sense. (less risky)
Next week, I will publish a 100% Trump-policy-based portfolio of stocks and a separate portfolio of ETFs. (riskier)
As many know, I run one of the fastest-growing investment newsletters in the world.
My background is in applied mathematics (MIT PhD), but my approach to investing has always been grounded, transparent, and data-driven rather than hidden behind incomprehensible formulas.
With Trump’s inauguration just days away (January 20th), the market is at a fever pitch. While I don’t buy into short-term hype or fearmongering, I do pay close attention to the structural changes any new administration might bring, particularly around energy policy, technology priorities, and regulatory shifts.
Below, I’ll share the 15 stocks I’m adding to my portfolio right now—equally weighted to keep risk balanced and to express my conviction that each name stands strongly on its own fundamentals. Some of these tickers are household names, and some you may never have heard of.
However, each selection has robust fundamentals, attractive growth metrics, and potential upside in the evolving political environment.
But here’s the big twist: This portfolio isn’t just about short-term opportunity. If you look closely at the data—everything from trailing 12-month revenue growth to net margins, alpha, correlation, and advanced risk metrics—you’ll see that each stock offers a compelling balance of risk-adjusted return potential. Let’s dig into the details.
Portfolio Performance in Context
Before revealing the individual picks (with deeper details for paid subscribers at the end), let’s look at some portfolio-level numbers—because they paint a picture of what’s possible when you combine thorough fundamental analysis with strategic timing:
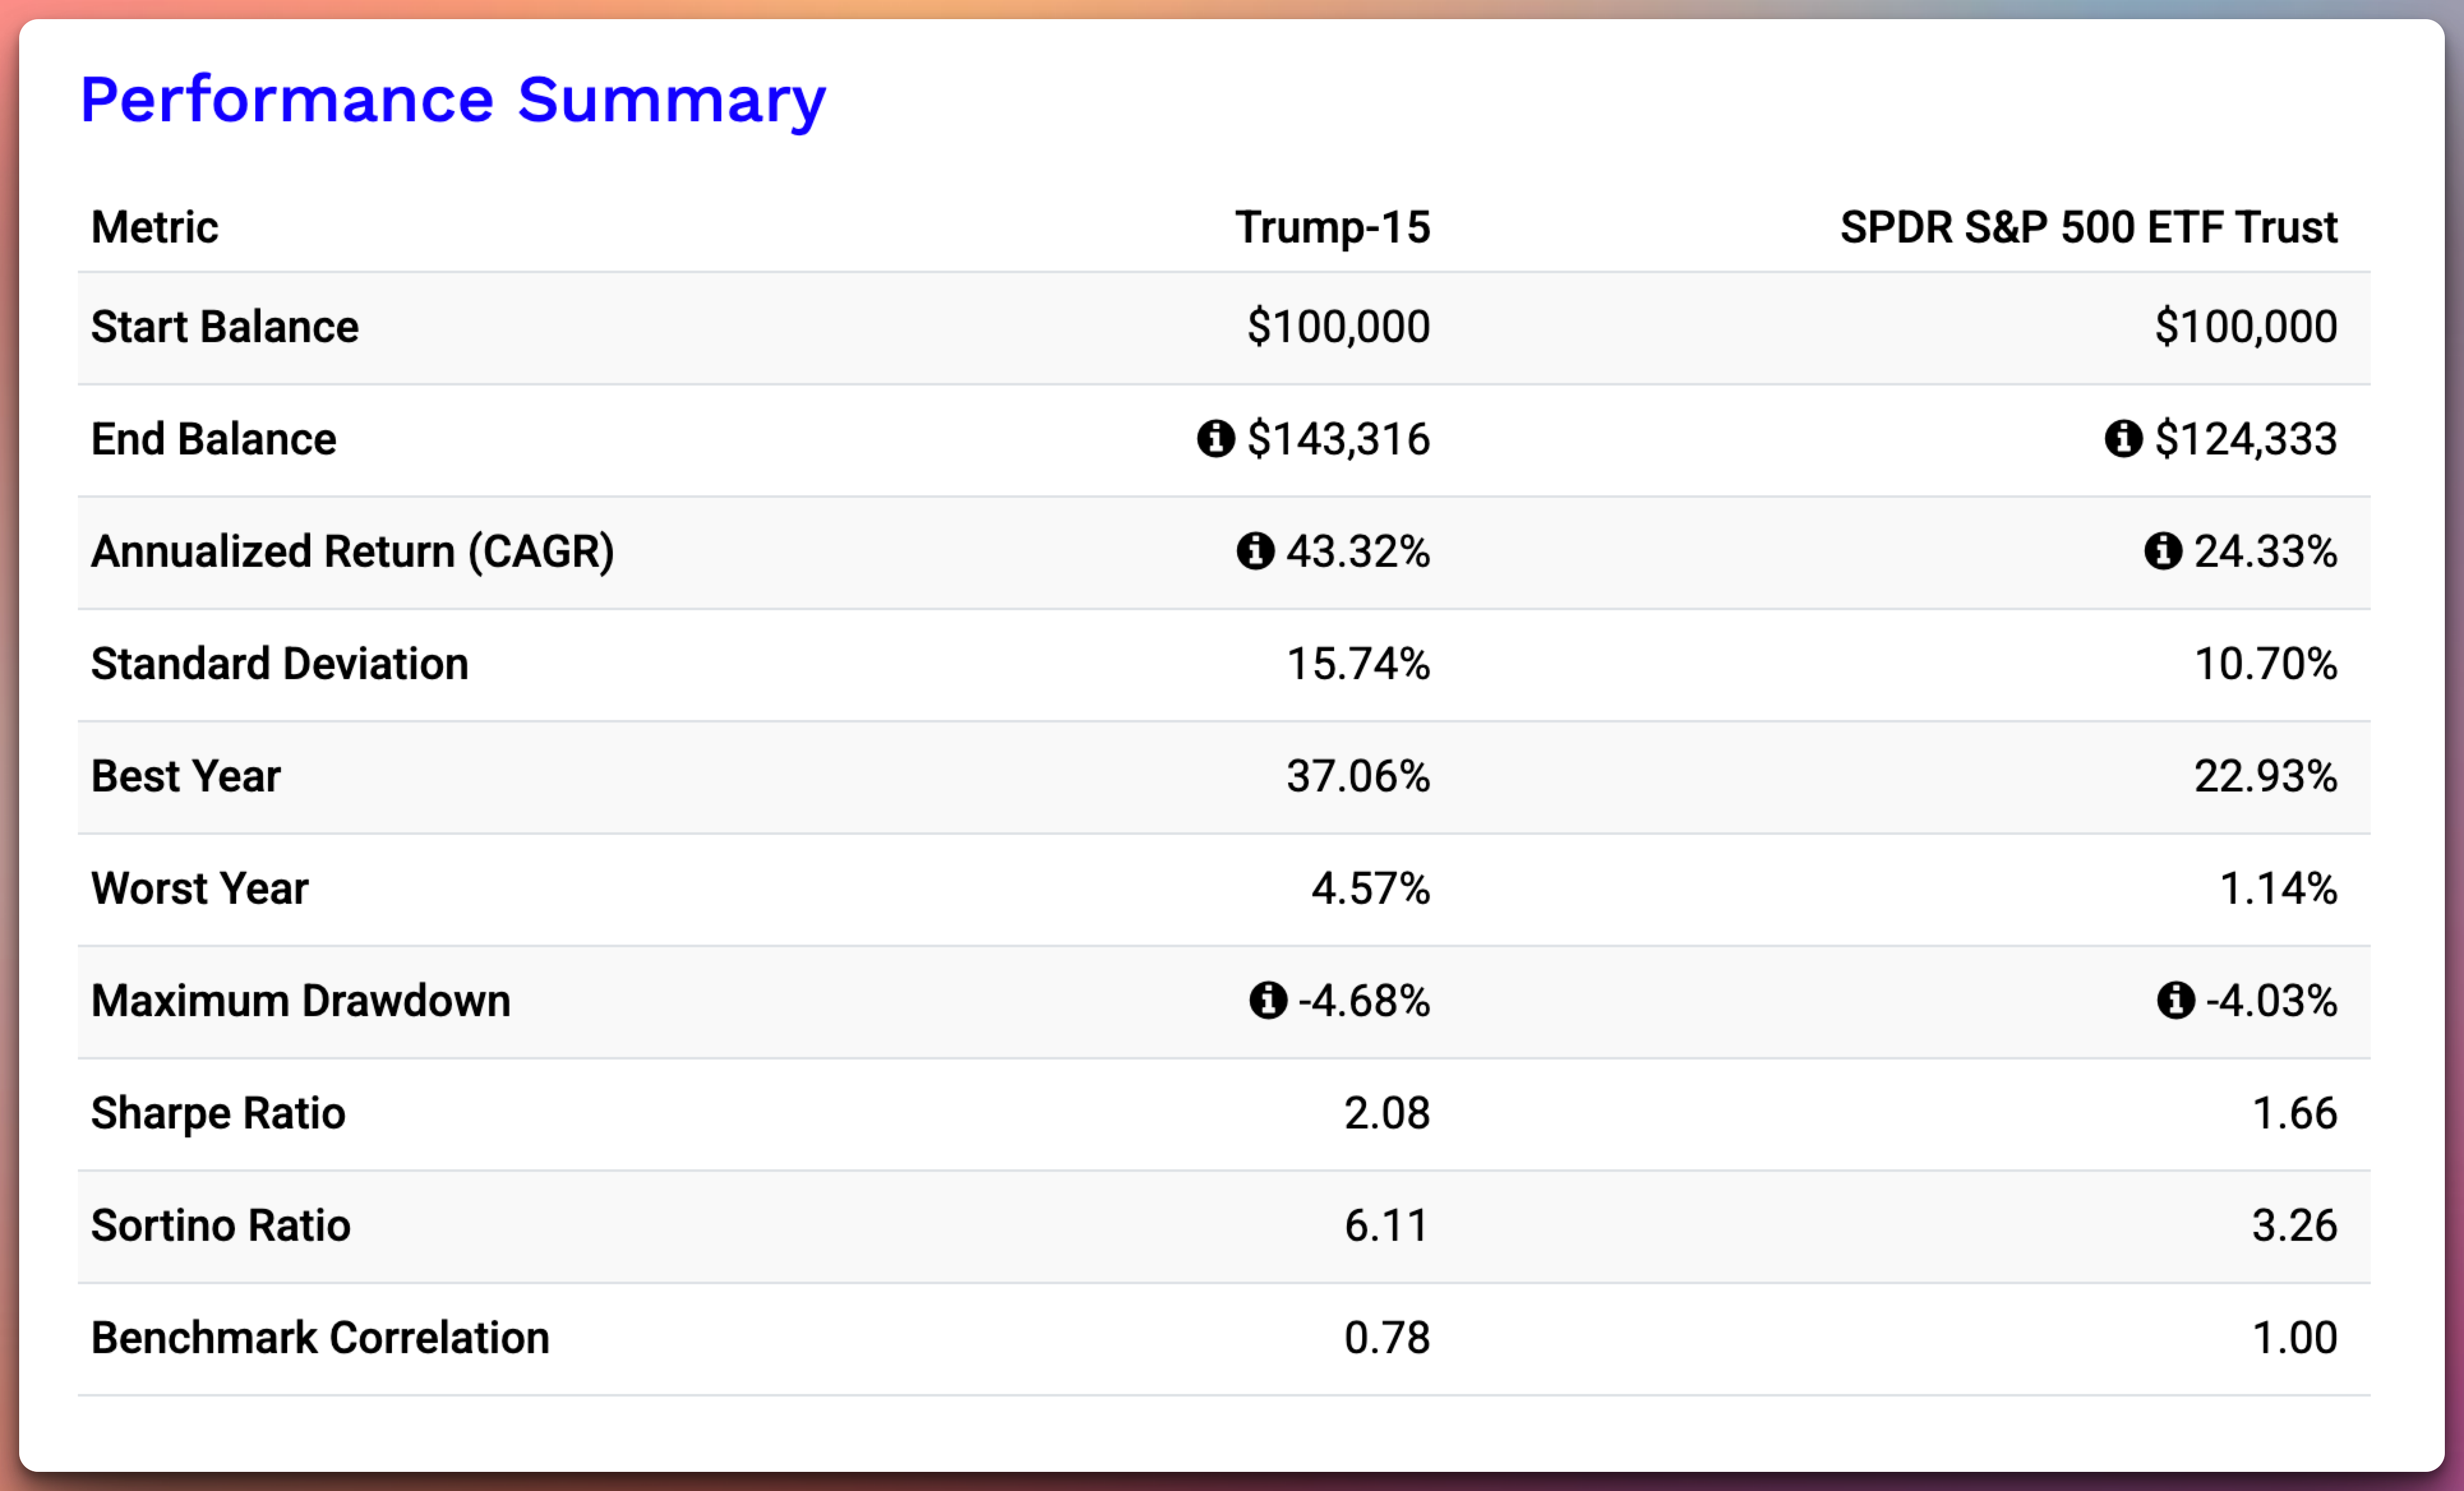
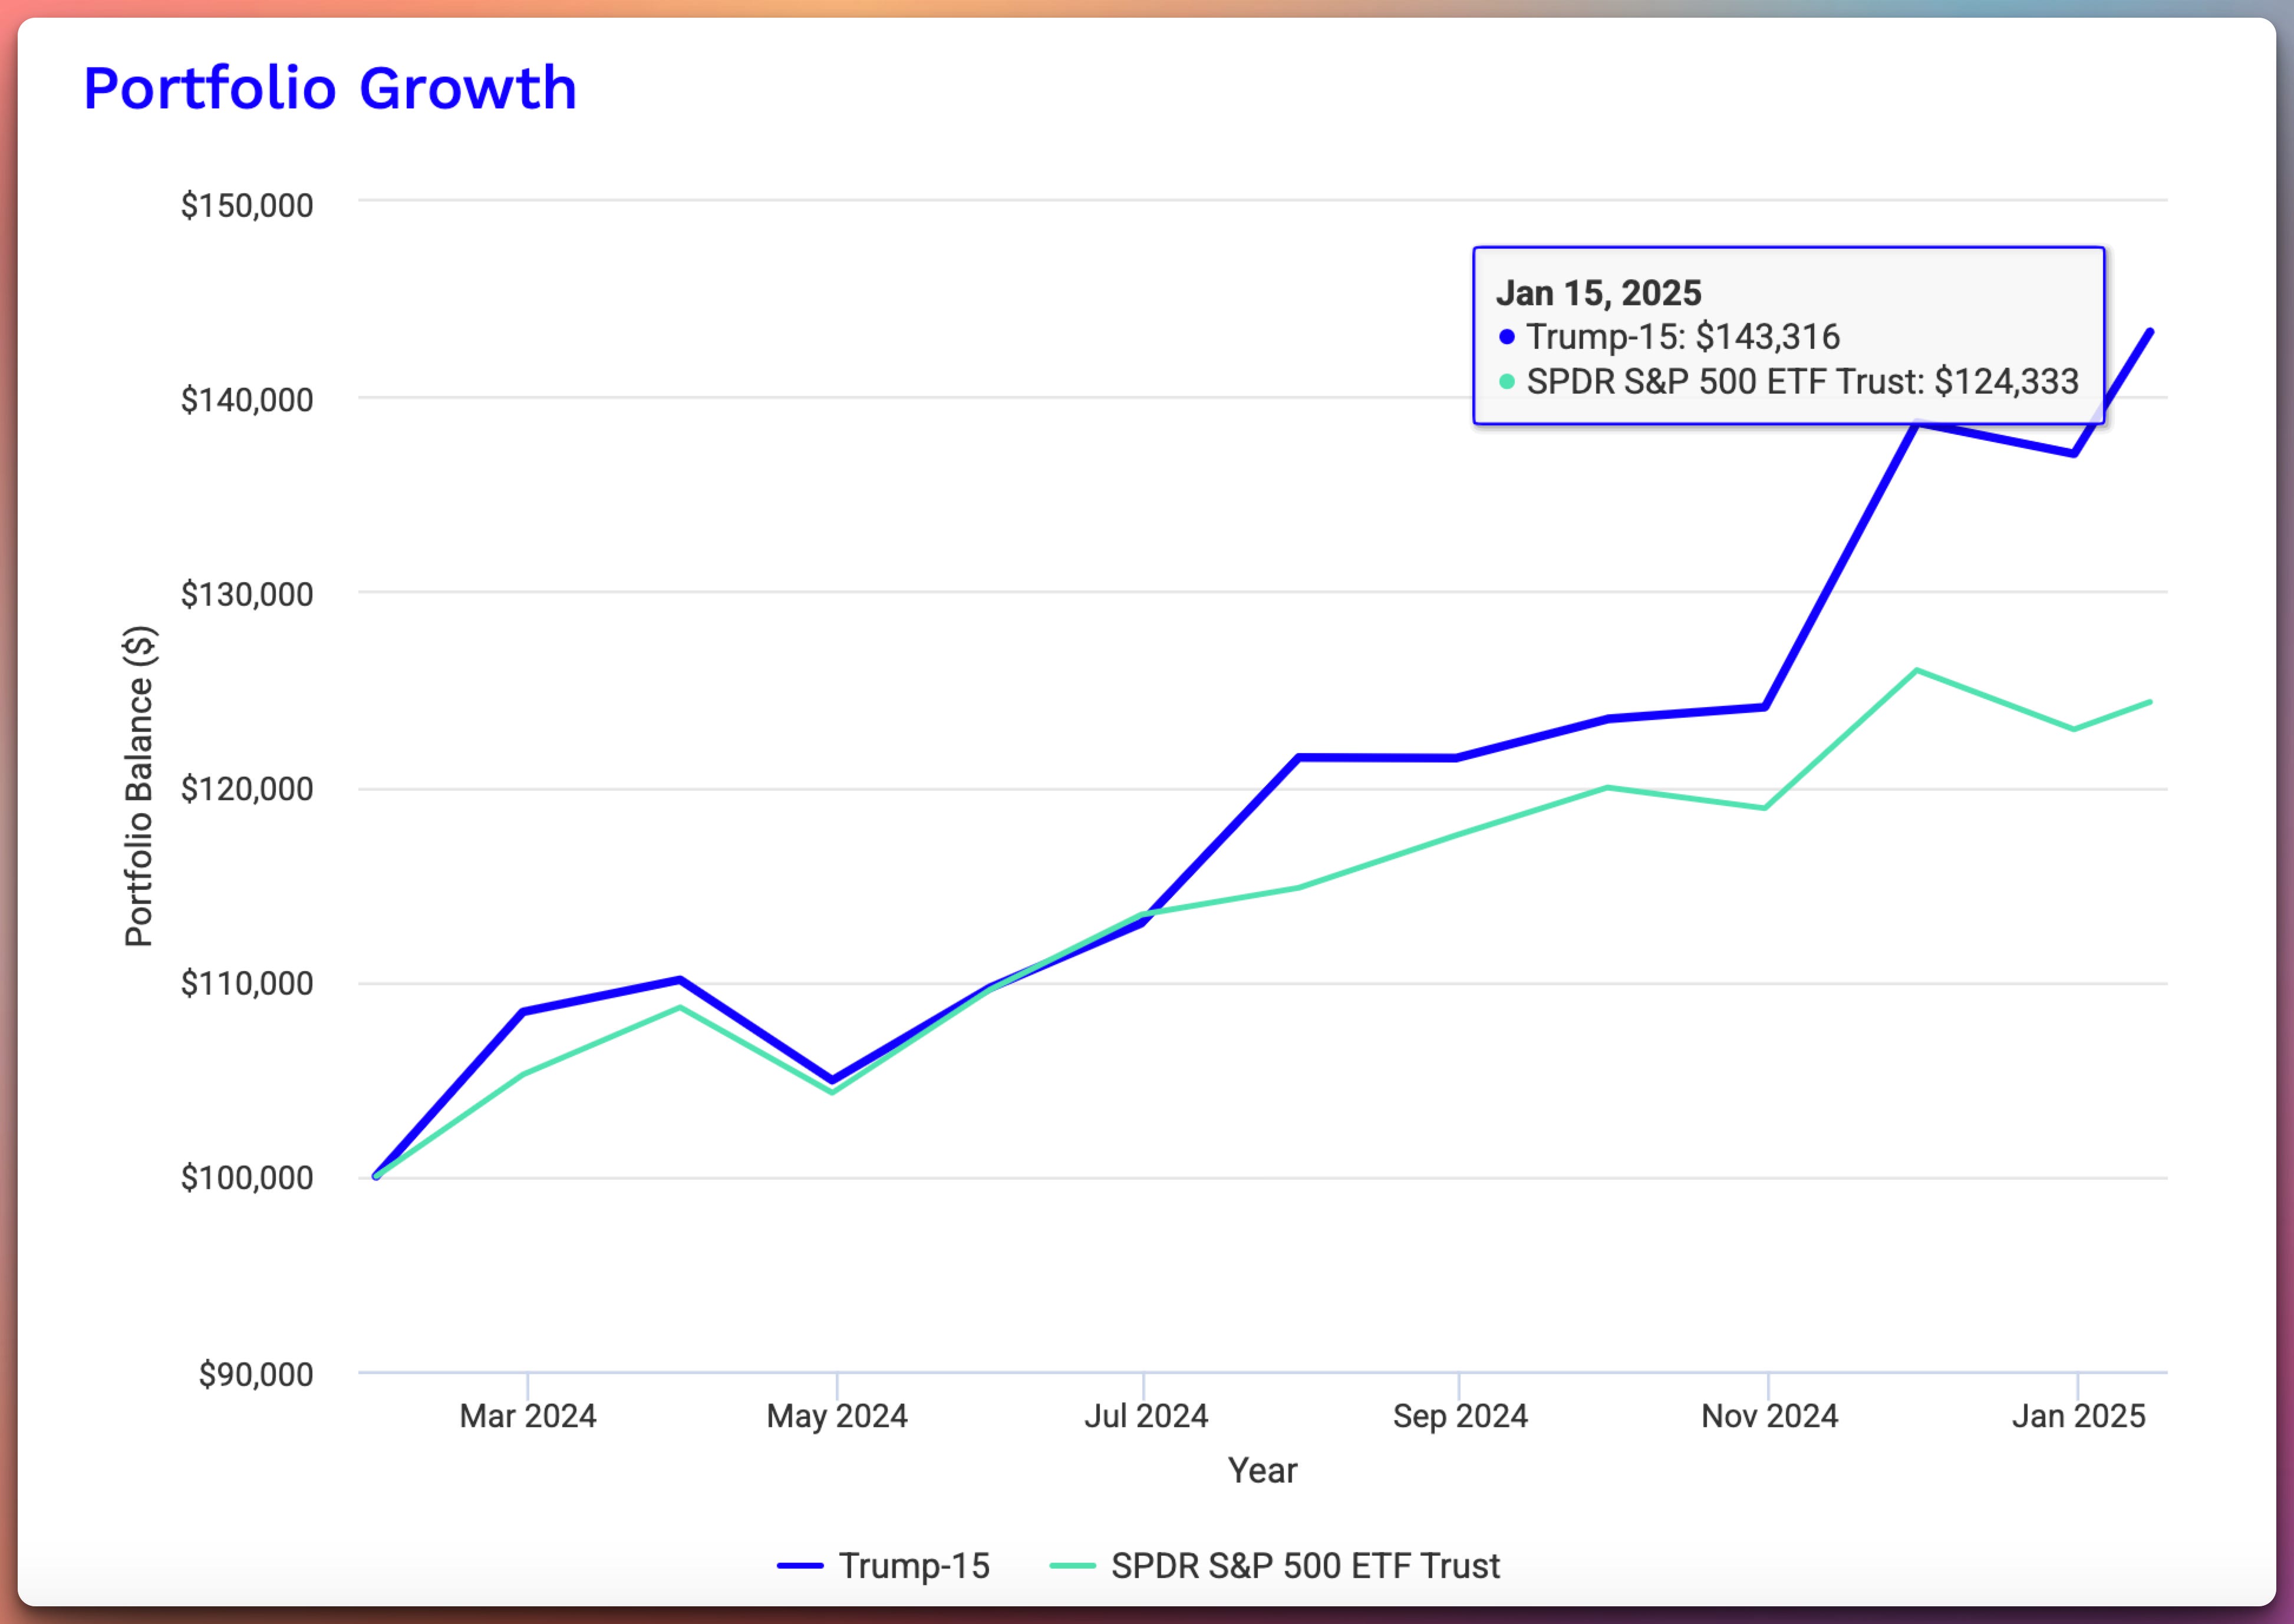
Start vs. End Balance: In our January 2025 backtest, a $100,000 investment in this strategy (allocated across these 15 names) would end the period at $143,316. By contrast, the same $100,000 in the SPDR S&P 500 ETF (SPY) would end at about $124,333.
Annualized Return (CAGR):
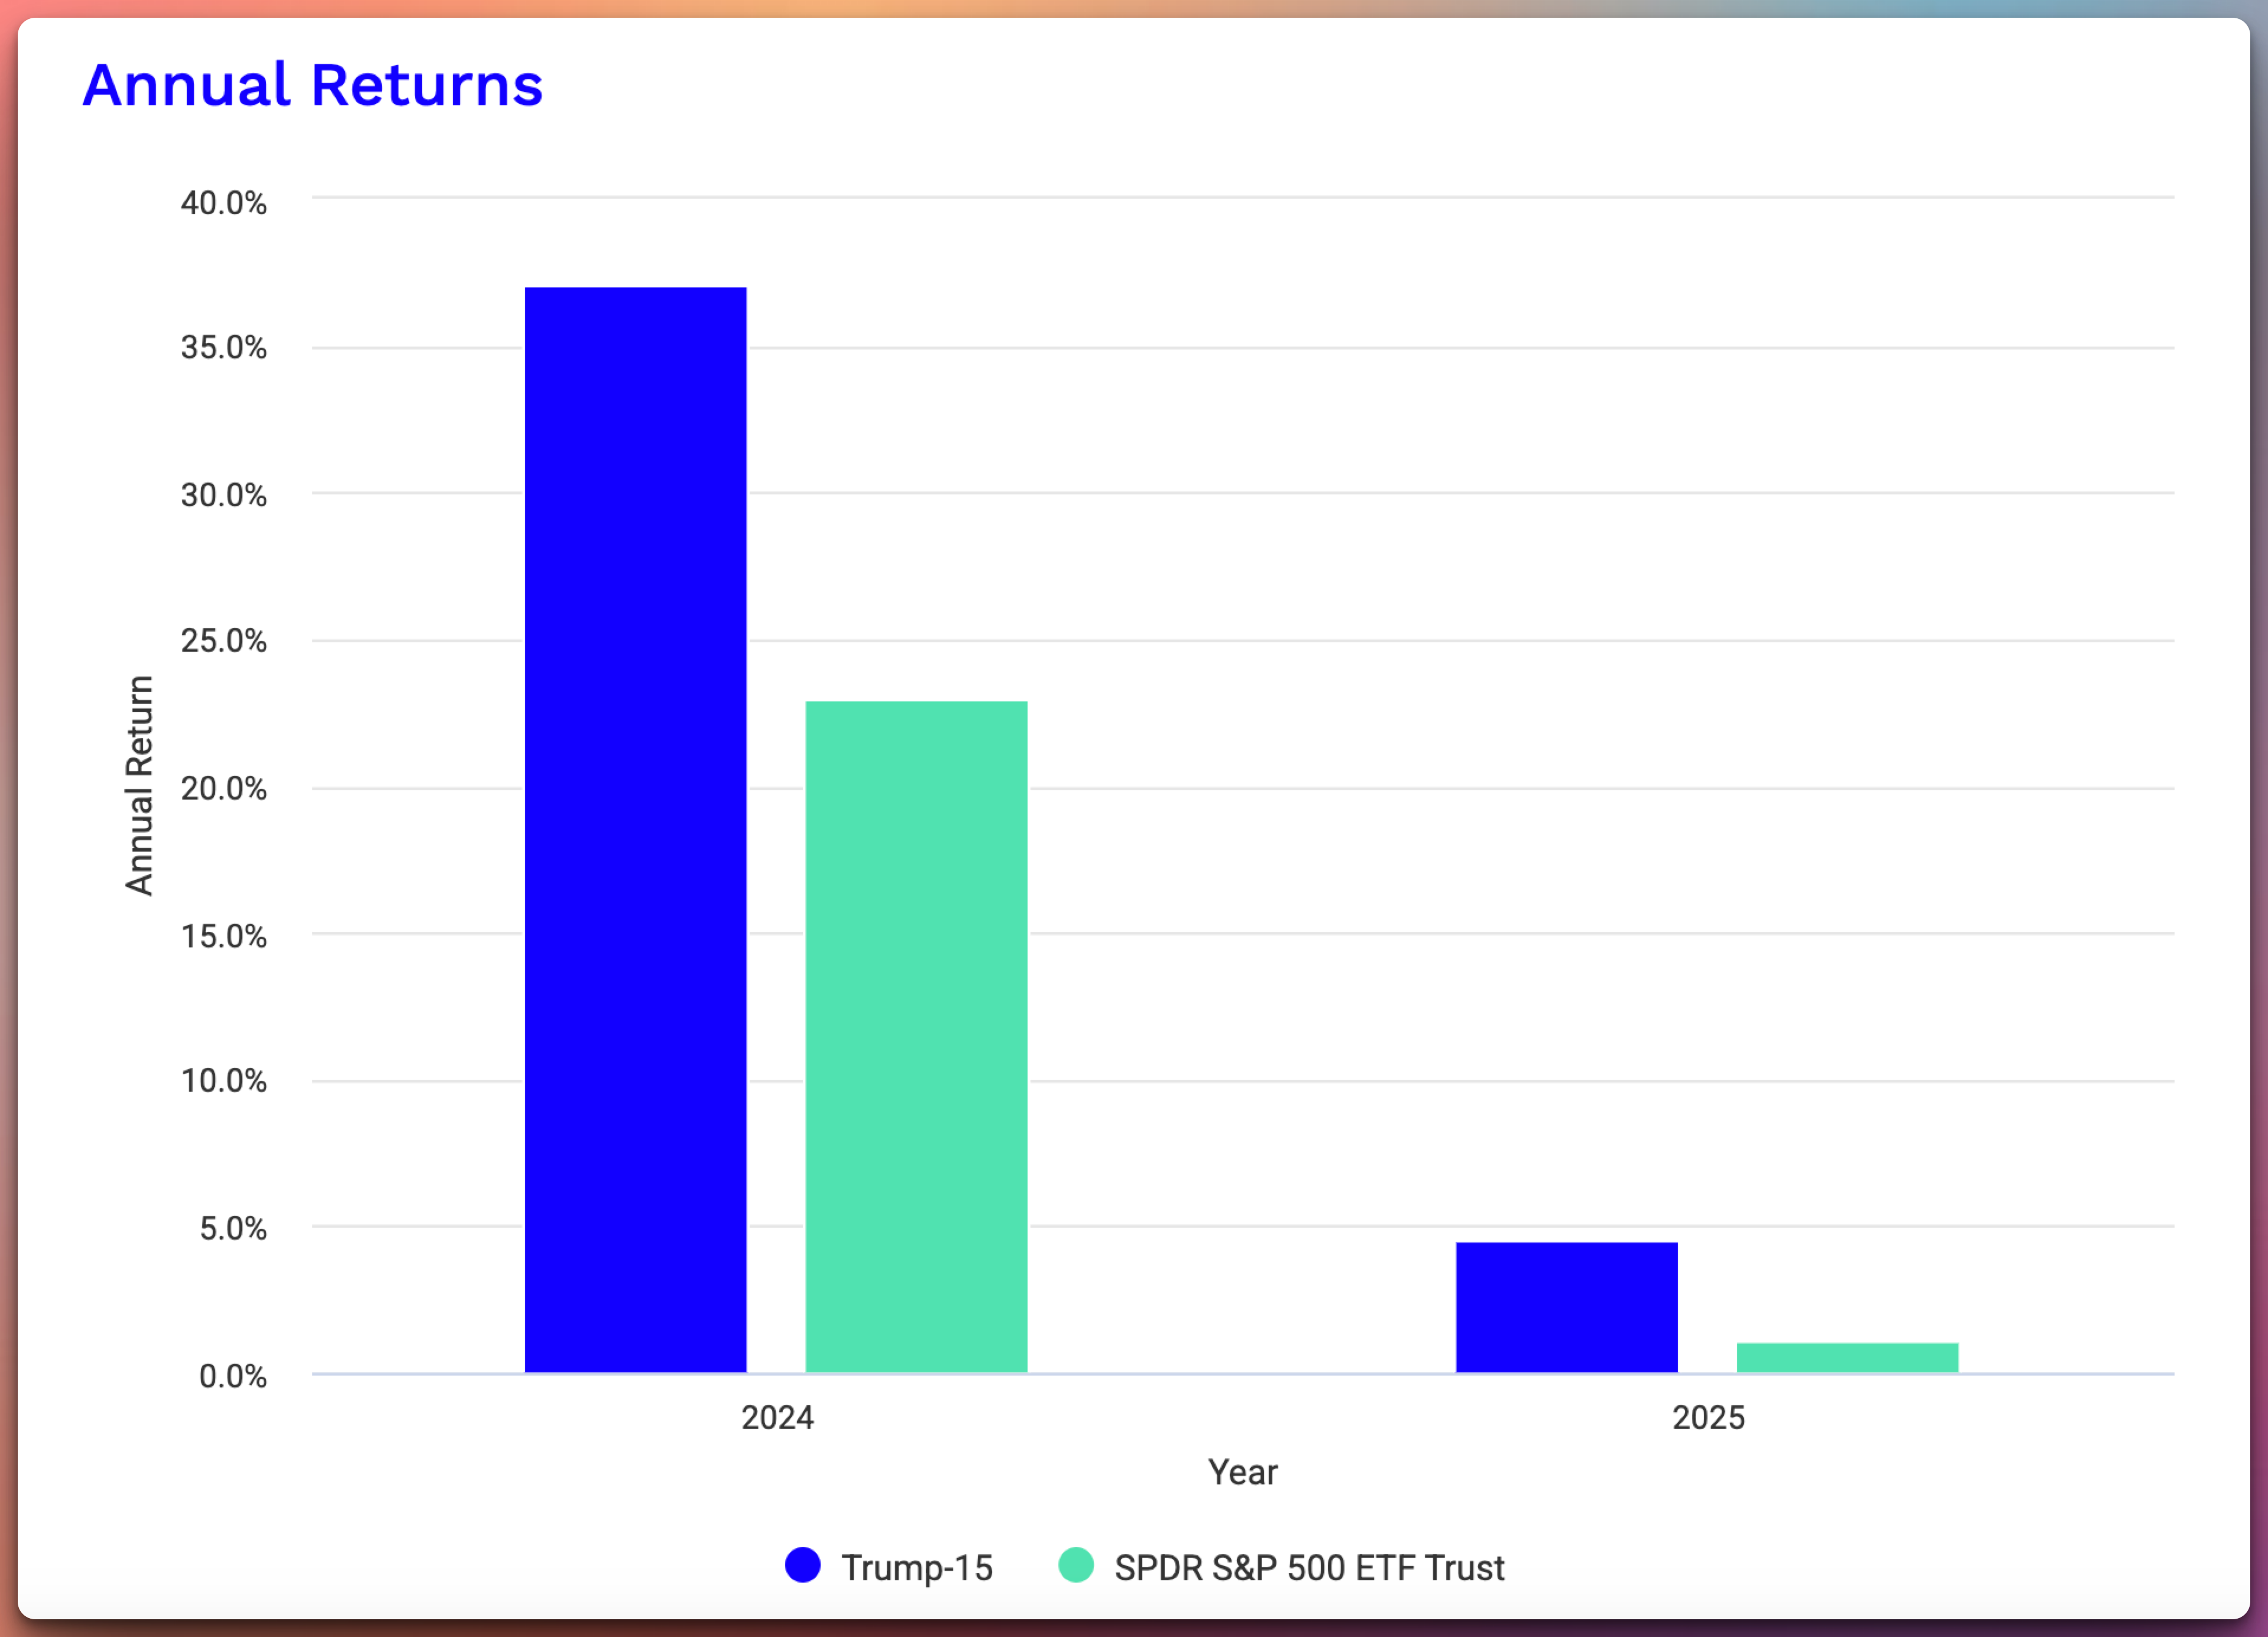
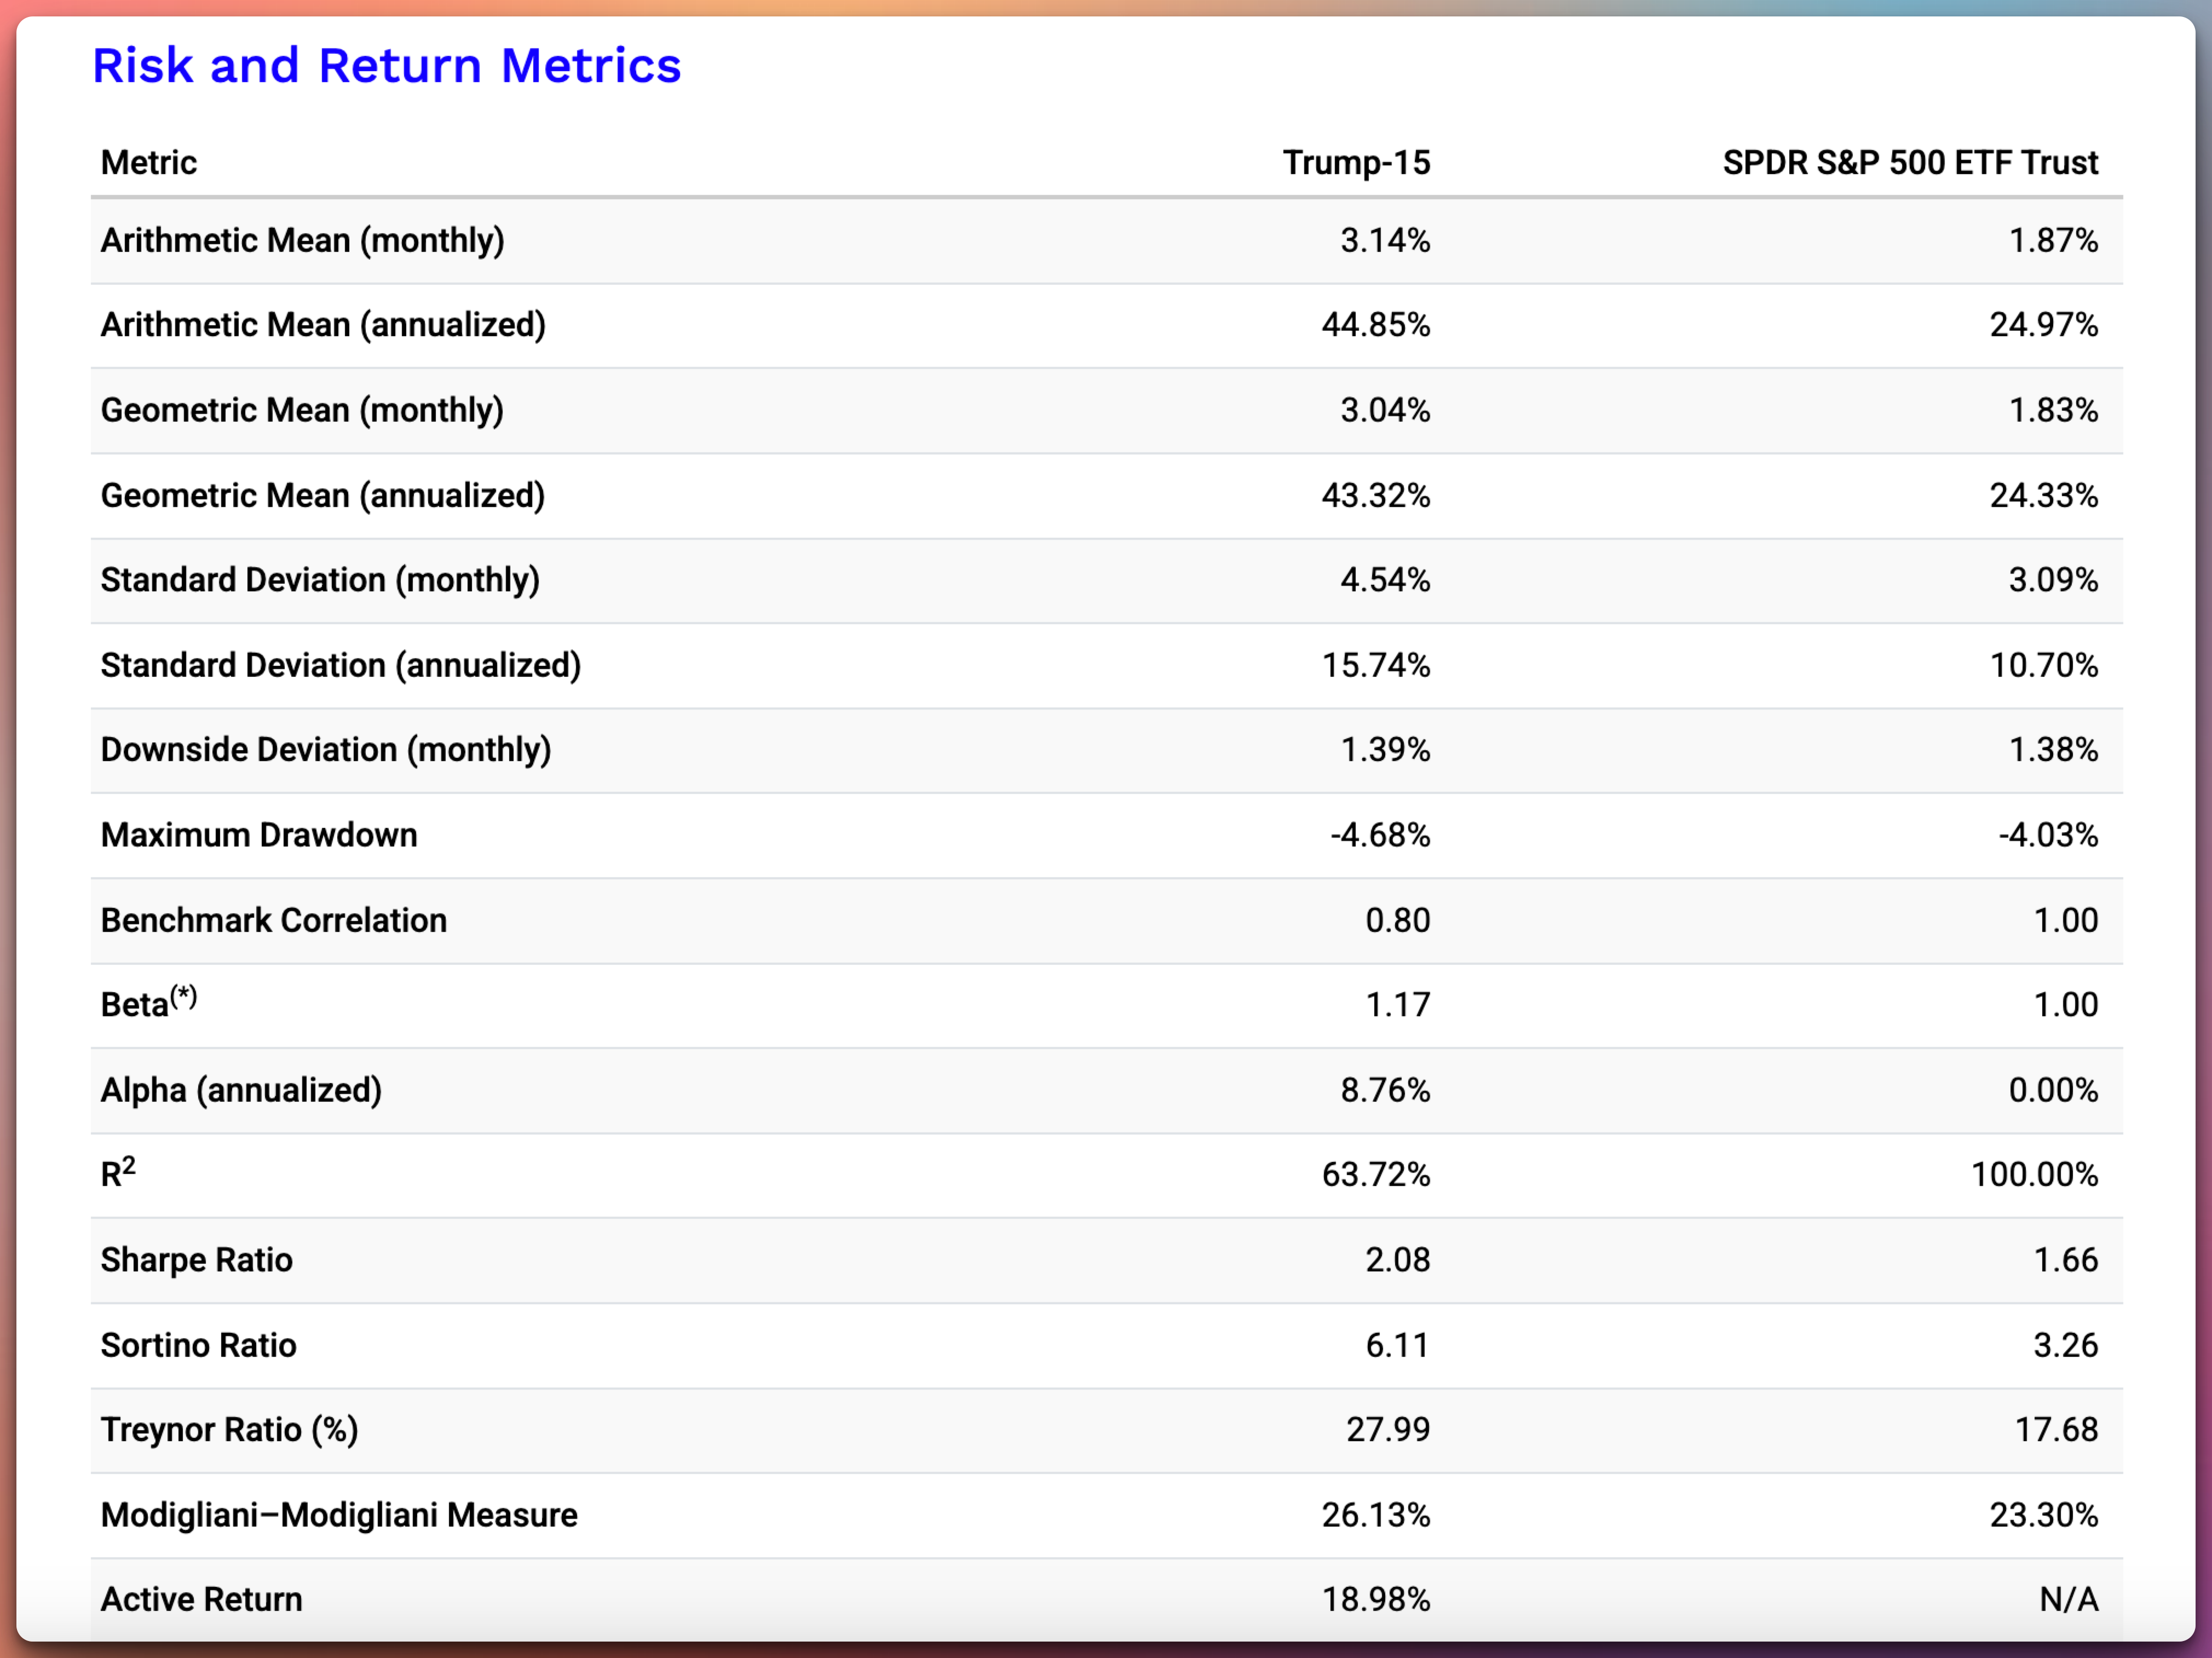
Portfolio: 43.32%
S&P 500 (SPY): 24.33%
Standard Deviation (Annualized):
Portfolio: 15.74%
S&P 500 (SPY): 10.70%
This portfolio’s return profile is almost double that of the S&P 500, and while the volatility (stdev) is higher, the jump in returns more than compensates, as seen in the robust Sharpe and Sortino ratios:
Sharpe Ratio:
Portfolio: 2.08
S&P 500 (SPY): 1.66
Sortino Ratio:
Portfolio: 6.11
S&P 500 (SPY): 3.26
A Sortino Ratio above 6 is particularly impressive; it indicates the portfolio’s returns are high relative to its downside risk. In other words, we’re not just chasing returns blindly—these companies are well-selected to limit drawdowns while capturing upside.
Additional Advanced Metrics
Beta: 1.17, vs. 1.00 for the S&P 500
The portfolio is more sensitive to overall market movements, which makes sense given its high-growth tilt.
Alpha (Annualized): 8.76%
This means that even after accounting for the extra market risk (beta > 1), the portfolio still significantly outperforms the market.
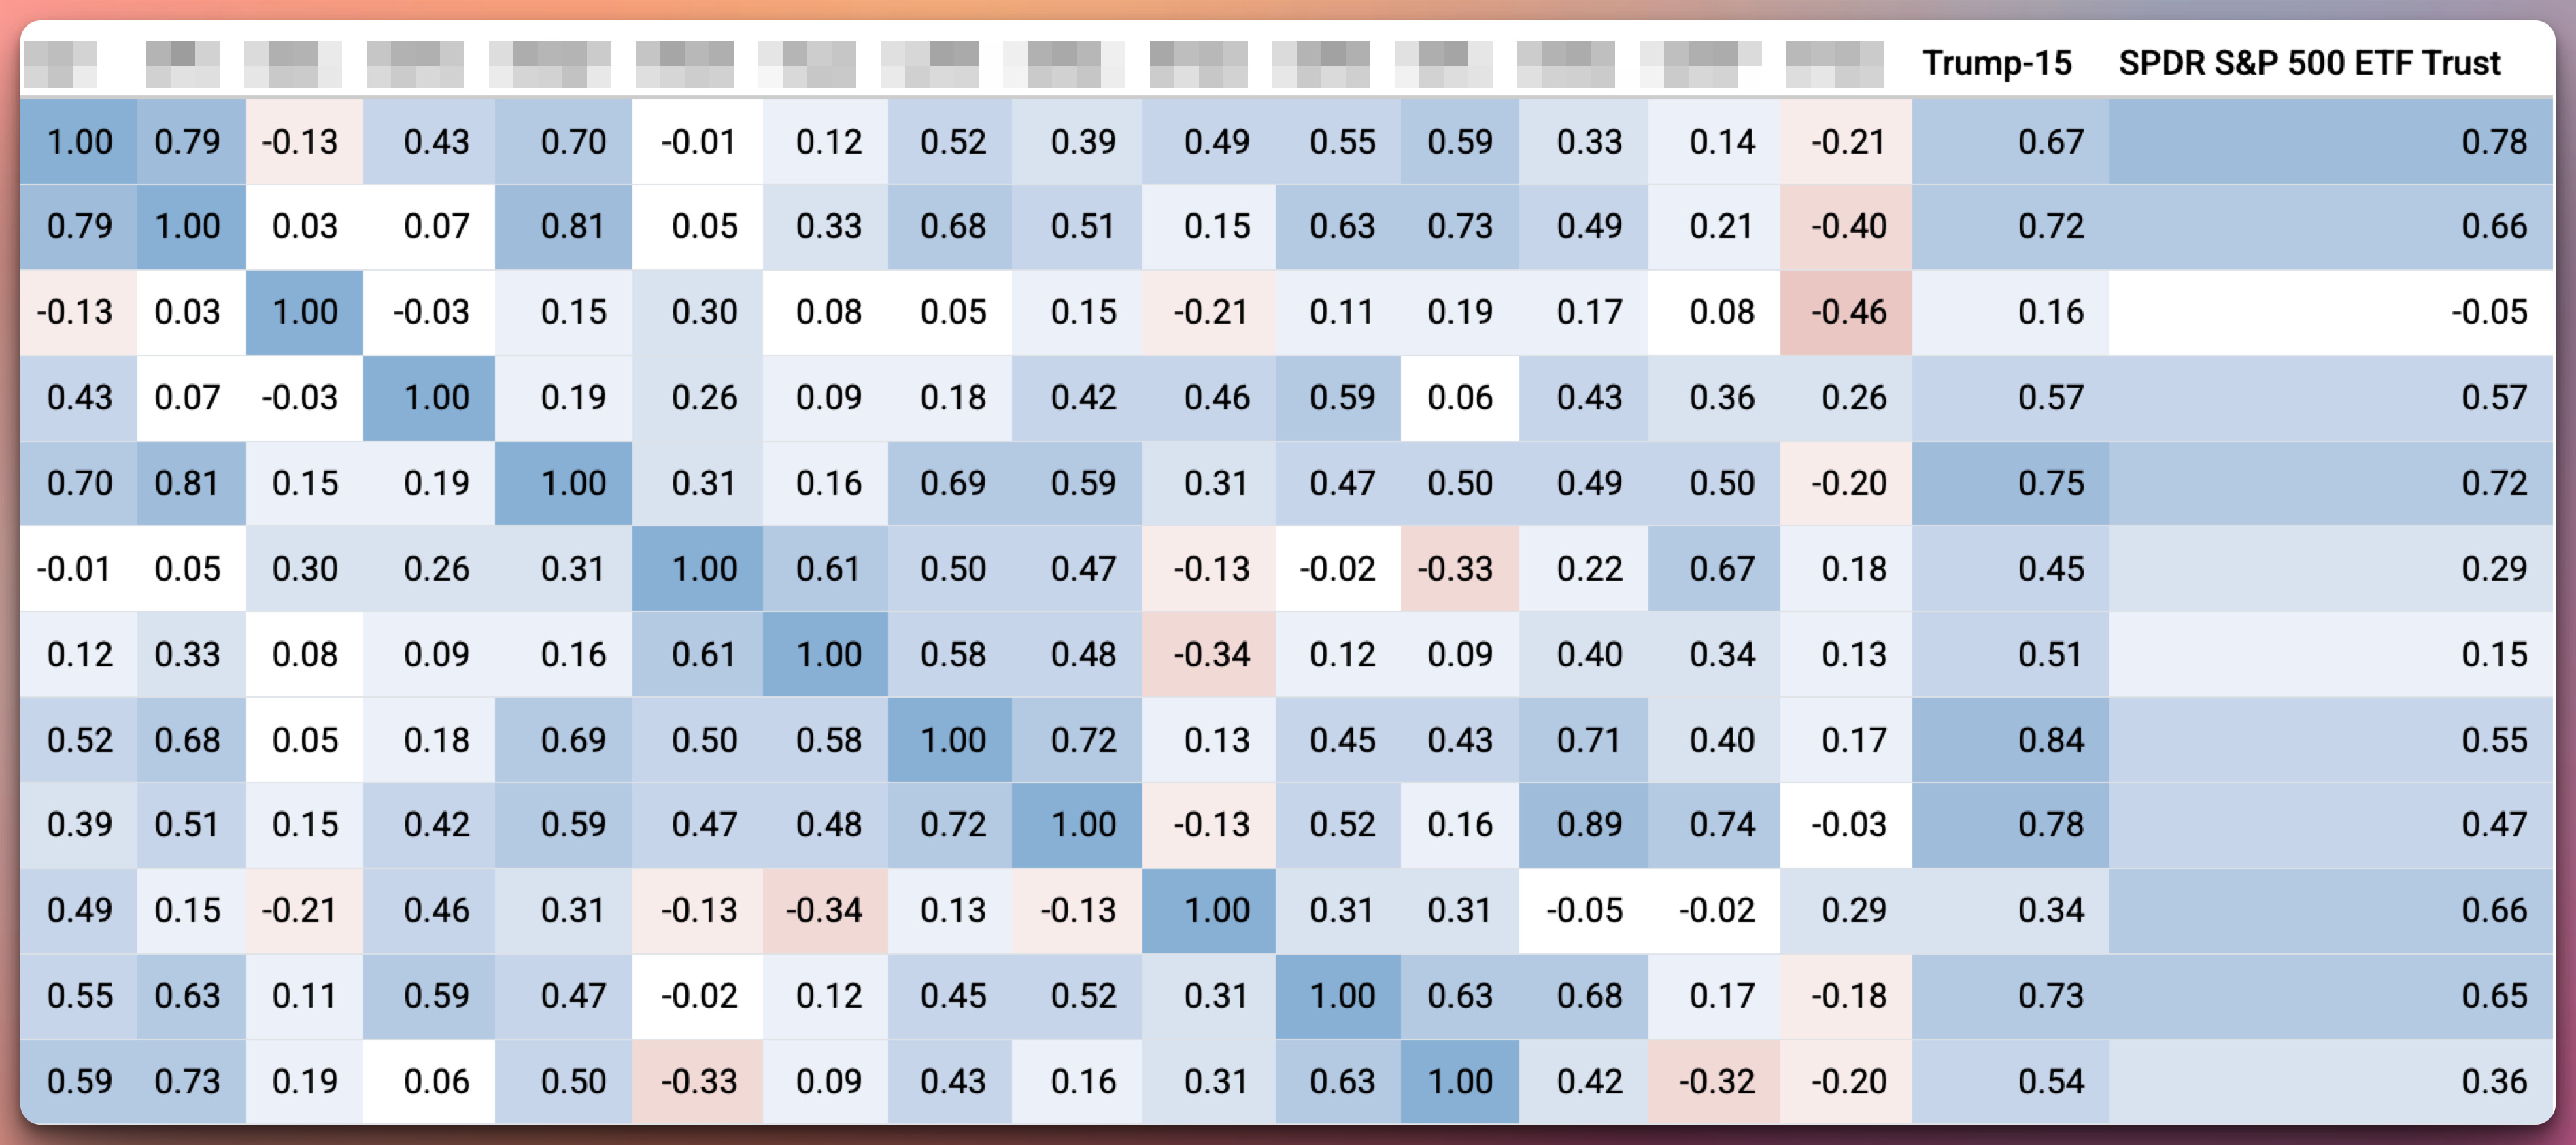
Benchmark Correlation: 0.80
A correlation of 0.80 is moderately high but still leaves room for idiosyncratic (stock-specific) alpha.
R²: 63.72% vs. 100% for the benchmark
This implies around 36% of the portfolio’s movements are not explained by the S&P 500—again, highlighting some diversifying characteristics.
Upside Capture Ratio: 151.32%
When the market goes up, our portfolio tends to capture 151% of that upside—an excellent figure for active investors.
Downside Capture Ratio: 74.16%
When the market drops, we tend to only capture about 74% of that downside, helping protect your capital.
Asset Allocation, Style, and Sector Exposure
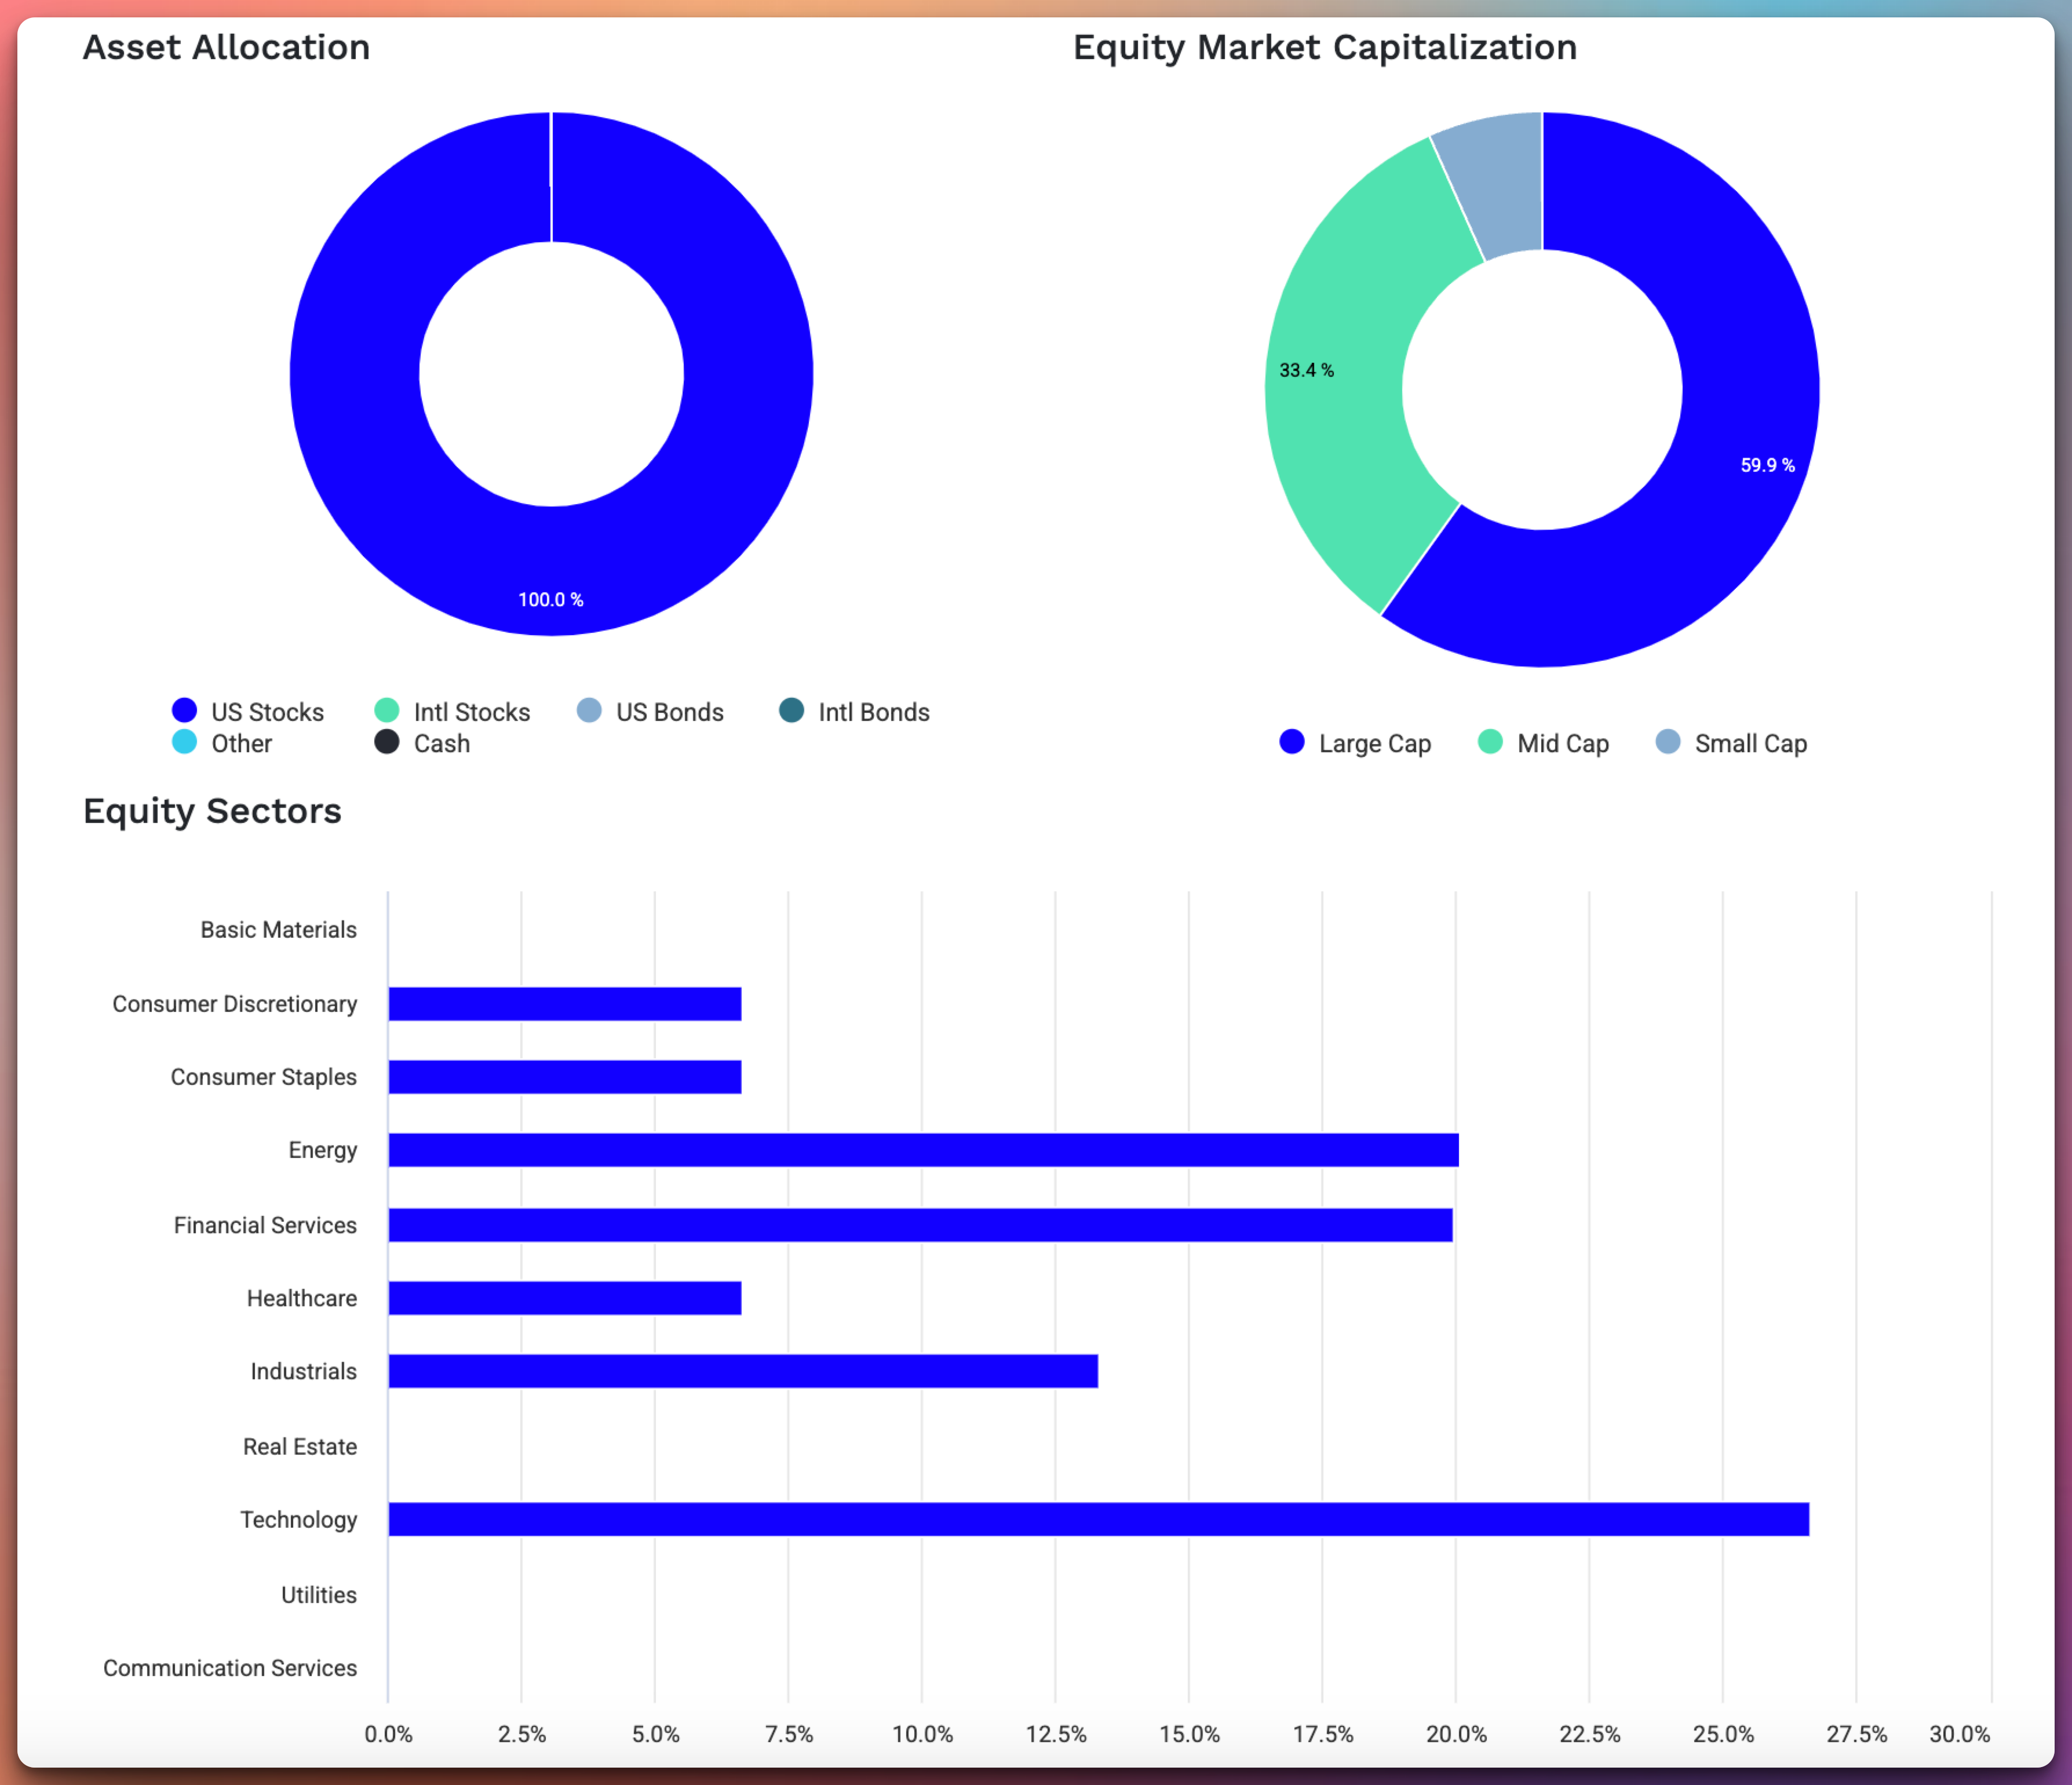
From the sector chart, you’ll see we’re heavily weighted in:
Technology
Energy
Financial Services
Industrials
Consumer
Healthcare
Despite focusing on U.S. stocks, you’ll also see large-, mid-, and small-cap distributions, with roughly 60% in large caps, ~33% in mid caps, and a small slice in smaller or more specialized names.
Looking Beyond Historical Performance
You’ll notice that some of the picks have mind-blowing historical CAGR while others are more modest. My rationale: I’m not simply chasing past returns. In each case, there’s a fundamental story:
Robust Net Margins – At least half of these companies produce double-digit net margins.
Promising Revenue Growth – Particularly in tech and energy, where TTM revenue expansion signals resilience.
Favorable Technical Indicators – Several are showing “Strong Buy” or bullish momentum based on 1-month or short-term signals.
Policy Tailwinds – Midstream energy could see expansions under a pro-fossil-fuel White House. Financials could benefit from friendlier regulations. Healthcare, technology, and industrials may see targeted spending expansions or contract opportunities.
Combine these factors with the portfolio’s advanced metrics—Alpha of 8.76%, Upside Capture of 151.32%, and a Sortino Ratio over 6—and you get a compelling risk/reward profile.
Monthly Returns
The Cliffhanger: Advanced Fundamentals & My Proprietary Price Targets
If you’ve been following me for a while, you know I do deep dives—more than just listing a ticker and a bullet point or two from public news. My premium reports include:
Discounted Cash Flow (DCF) Models for each company, adjusting for potential regulatory shifts.
Scenario Analysis: “Best-case,” “base-case,” and “worst-case” outcomes for each stock under different Trump administration policies, interest rate changes, or supply chain disruptions.
Technical Overlays: I build advanced multi-timeframe charts with trend confirmations, relative strength data, and volumes that help refine entry/exit points.
Income Investors’ Section: For yield-hungry subscribers, I show how to harness the midstream MLPs and BDC for steady distributions potentially.
All of these advanced insights—plus my proprietary price targets for the next 12–18 months—are only available to my paying subscribers. If you’re already a premium member, that's wonderful. Click through to read the extended breakdown right away.
If you’re on the free list and want the in-depth analysis, including exact valuations, expected time horizons, risk management tips, and frequent updates during the next few weeks, now’s the time to upgrade your subscription.
The 15 Picks (With Key Data Points)
I’m equally weighing these 15 stocks. Yes, that means each ticker represents roughly ~6.66% of the portfolio (give or take, given that 15 × 6.66% ≈ 100%).
This approach can sometimes overweight smaller, high-growth names while underweighting behemoths—but it also ensures that each high-conviction idea pulls its own weight.
Below, I’ll tease out the highlights from fundamentals, last-month indicators, and recent technical signals. Then, I’ll break down each ticker’s key stats—like CAGR, standard deviation, best/worst year, max drawdown, Sharpe ratio, and Sortino ratio.
It is available after the paywall for those who want the full deep dive (price targets, detailed risk assessments, cash flow analyses, etc.).
The 15 Stock Picks:
Keep reading with a 7-day free trial
Subscribe to The Stock Insider to keep reading this post and get 7 days of free access to the full post archives.