


⭐️ The Not-So-Boring Guide to Swing Trading
Where Technical Analysis Meets Common Sense

[Jack’s note: Another amazing, free, non-sponsored Masterclass from my buddy Golden Bear Capital.]
A reminder of what is happening this week at The Stock Insider and the last few days to get a lifetime membership. Ever:

Let's face it—most trading guides often resemble the dry and uninspiring instruction manuals that come with assembling IKEA furniture.
While these guides may be technically correct, they tend to be painfully monotonous, leaving readers overwhelmed and disengaged.
The dense jargon and uninviting prose can turn even the most enthusiastic novice into a disheartened skeptic of the trading world. But what if we could flip the script?

The Technical vs Fundamental Battle Royale
While many investors fixate on P/E ratios and the latest quarterly reports, the undeniable truth is that technical analysis forms the backbone of successful swing trading strategies. In this fast-paced trading environment, understanding price movements, chart patterns, and market trends can provide you with a significant edge. However, it's crucial not to underestimate the importance of fundamentals—after all, “solid fundamentals never hurt." Strong and consistent sales growth can act as a powerful catalyst for a stock's performance, potentially propelling its value upward by 100%, 200%, or even an astonishing 300% or more.
Here's the dirty little secret of Wall Street: Markets run on stories, not spreadsheets.
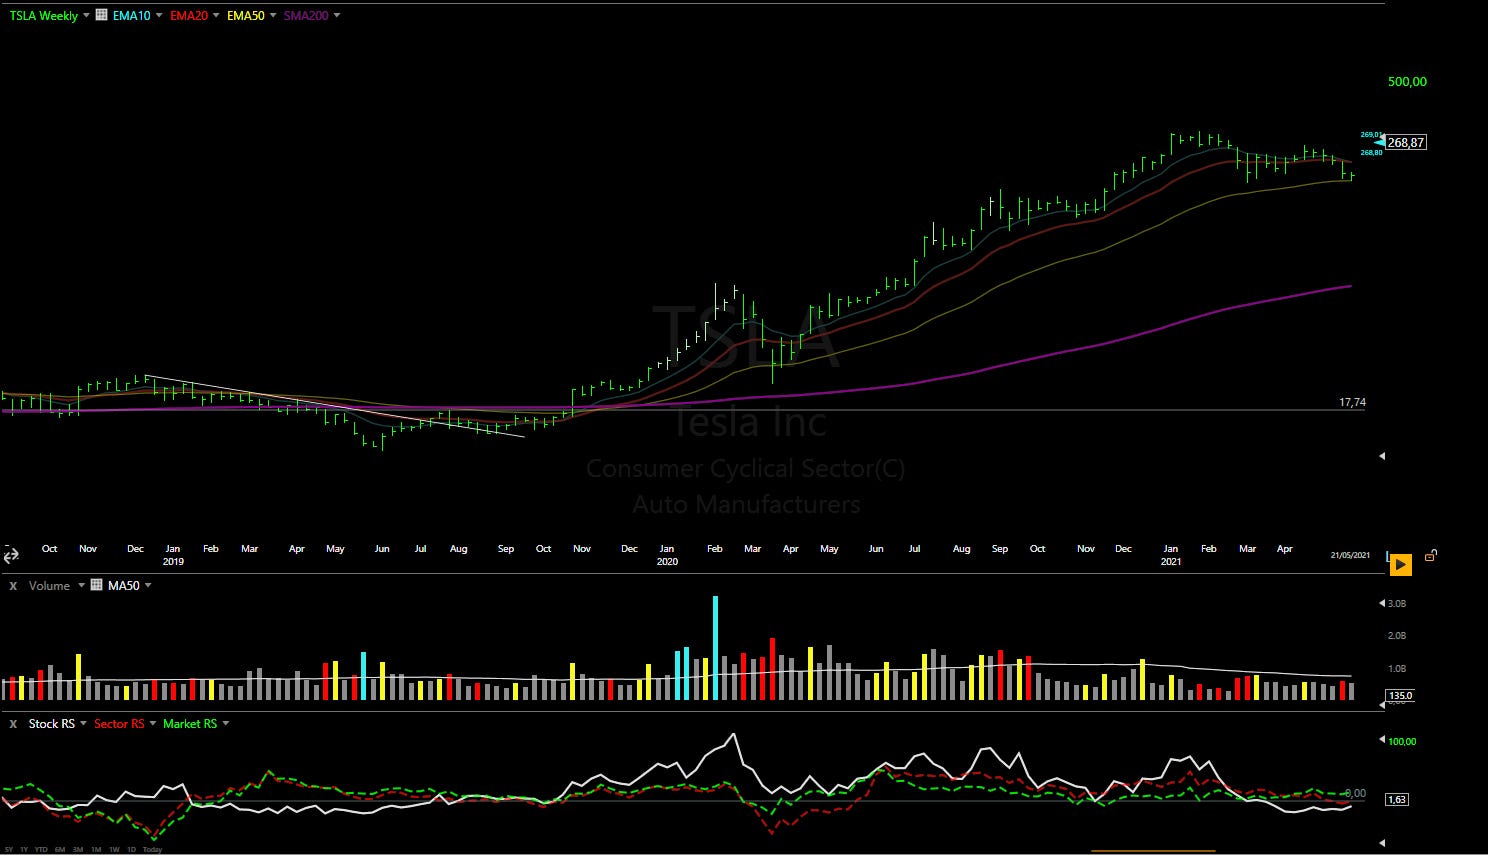
Think about it. While some old-school analysts are still calculating the perfect P/E ratio for Tesla in 2020, traders who followed the technical signals and market momentum were busy counting their profits. Did Tesla's fundamentals justify its meteoric rise? About as much as a chocolate teapot makes practical sense. But did it matter? Not one bit.
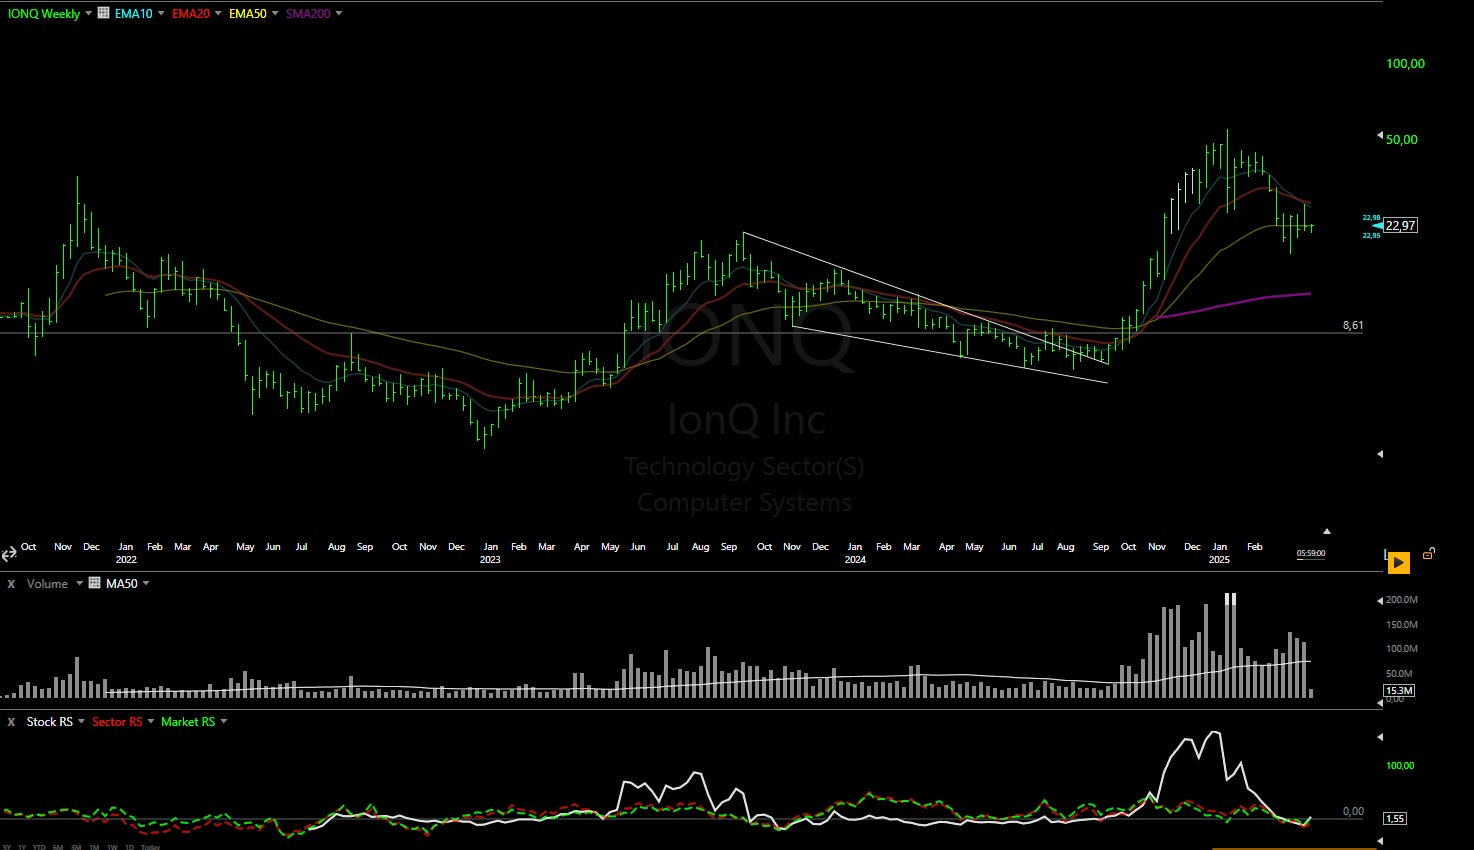
Remember the quantum computing gold rush in 2024? Companies with barely enough revenue to pay for their office coffee machines suddenly became market darlings. Why? Because they were selling something far more powerful than earnings – they were selling dreams. And dreams, my dear market enthusiasts, have a funny way of defying traditional valuation metrics.
The technical signals caught these moves early. The chart patterns, volume spikes, and momentum indicators were screaming "buy" while fundamental analysts were still scratching their heads looking for positive cash flow. This is where the real money is made in swing trading – catching the wave of market psychology before the fundamental story either confirms or denies the move.
Now, don't get me wrong. Fundamentals aren't useless – they're like your responsible friend who keeps you from doing something crazy at 2 AM. They help you stay in winning trades longer and avoid complete disasters. When you find a stock with both technical momentum AND solid fundamentals, that's when you've found the holy grail. But in the short term?
Technicals are your best friend for timing entries and exits.
Stock Selection: The Art of Not Picking Garbage
In the vast universe of publicly traded companies, where every stock comes wrapped in promises of being "the next big thing," the most valuable skill isn't finding winners – it's avoiding losers. While this might sound like an exercise in stating the obvious, it's remarkable how many investors, from novices to seasoned professionals, consistently fill their portfolios with what can only be described as carefully packaged underperformance.
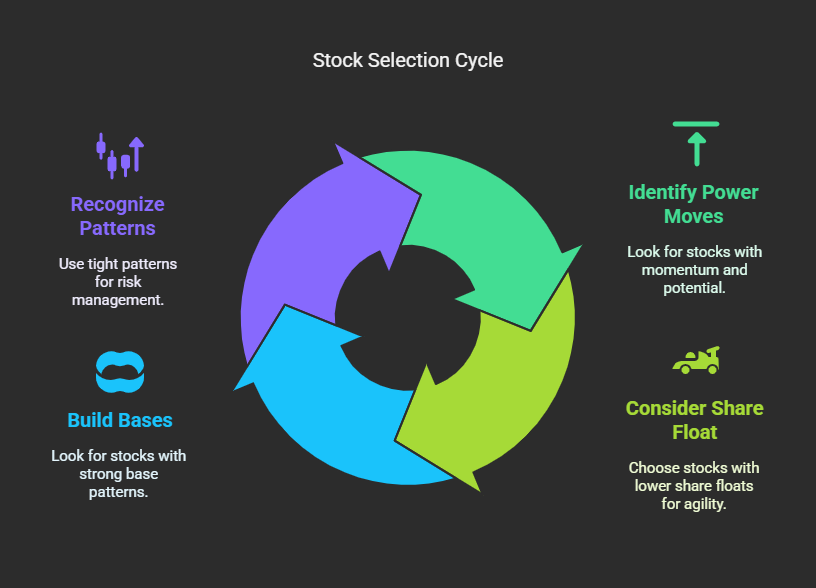
Let's break down what matters (straight from our trading bible):
Power Moves: Look for stocks that show a "prior display of power" and can make linear moves multiple days in a row. Think of it as momentum dating - you want someone going places, not someone stuck on their couch.
Size Matters (in Share Float): Stocks with share floats under ~100 million are like sports cars - easier to move and quicker to respond. Bigger floats are like trying to turn a cruise ship - possible, but painfully slow.
Base Building: "Bigger bases can lead to bigger moves." Think of bases as spring coils - the longer they compress, the more explosive they move. And those "shakeouts in bases"? That's when weak hands get flushed out, creating fuel for the next move up.
Always check daily, weekly, and monthly patterns to spot multi-timeframe alignment; that's the real holy grail in swing trading.
Pattern Recognition: Focus on tight patterns for a simple reason - smaller stop distances mean better risk management. It's like having an escape route planned before entering a haunted house.
Trend Lines: Your Market GPS
The more sophisticated our trading tools become, the more we return to these fundamental guideposts. It's rather like discovering that despite having access to the latest GPS technology, seasoned sailors still rely on the stars for their most crucial navigational decisions.
The beauty of trend lines lies not in their complexity – of which there is precious little – but in their ability to reveal the market's psychological battlegrounds where buyers and sellers repeatedly clash. These invisible lines of support and resistance have guided trading decisions worth billions, though you'd rarely hear this discussed at flashy financial conferences where the latest trading indicators are unveiled with the fanfare usually reserved for smartphone launches.
Here's the real deal about using them:
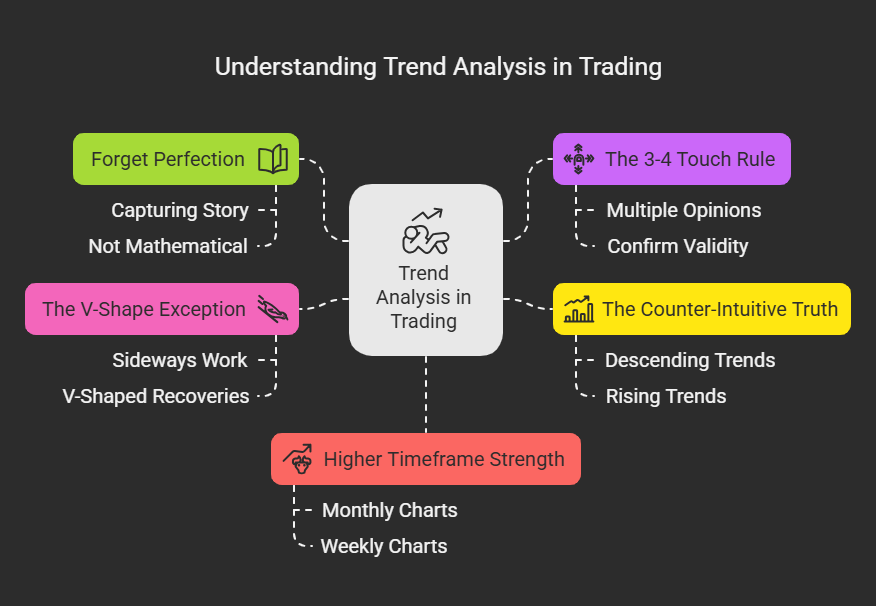
Forget Perfection: They don't need to be 100% exact. You're capturing the story, not writing a mathematical thesis.
The 3-4 Touch Rule: You want at least 3-4 touches to confirm validity. It's like getting multiple opinions before making a big decision.
The Counter-Intuitive Truth: "Descending trend lines/patterns lead to potential moves higher" while "Rising trend lines/patterns lead to potential moves lower." It's like a rubber band - the further it stretches, the stronger the snap back.
The V-Shape Exception: "Steeper trend lines/channels usually require more sideways work before advancing ('V's' are the exception, not the rule)." Don't expect every recovery to be V-shaped - most need time to build a proper base.
When the chart is damaged, it takes time to heal and form a new pattern. This is why you always hear that patience pays in trading.
The higher the timeframe, the stronger the line: We always start with monthly and weekly charts to identify the best supports, resistances, and trendlines. These are the most reliable. For a swing trader, anything under a 4-hour chart is just noise. You can look at 1-hour or 15-minute charts to time your entry point, but nothing beyond that!
Options: The Advanced Player's Game
Now, let's dive into options (this is where most guides fall short):
Strategic Time Selection
Let's talk about one of the most overlooked aspects of options trading that separates the professionals from the amateurs: strategic time selection. This isn't just about picking expiration dates – it's about understanding the delicate dance between time decay and market opportunity.
Here's where most traders get it wrong. They see a potential swing trade setup and immediately jump for the closest expiration dates, seduced by those cheaper premiums. It's like buying discount sushi – it seems like a good idea until it's not.
The 60-90 day window is where the magic happens for swing trades. Why? It's all about theta decay's cruel mathematics. The decay curve in this zone is relatively flat, like a gentle slope rather than a cliff edge. This gives you something precious in trading: breathing room. When you're targeting a 1-2 week move, the last thing you need is time working against you like a countdown timer in an action movie.
Think about it this way: If you're trading a stock with a two-week target, buying April options (assuming we're in March) is like trying to defuse a bomb while the timer is speeding up. But June or July options? Now, you're trading with a safety net. The theta decay is manageable, and you can focus on what matters – the directional move you're anticipating.
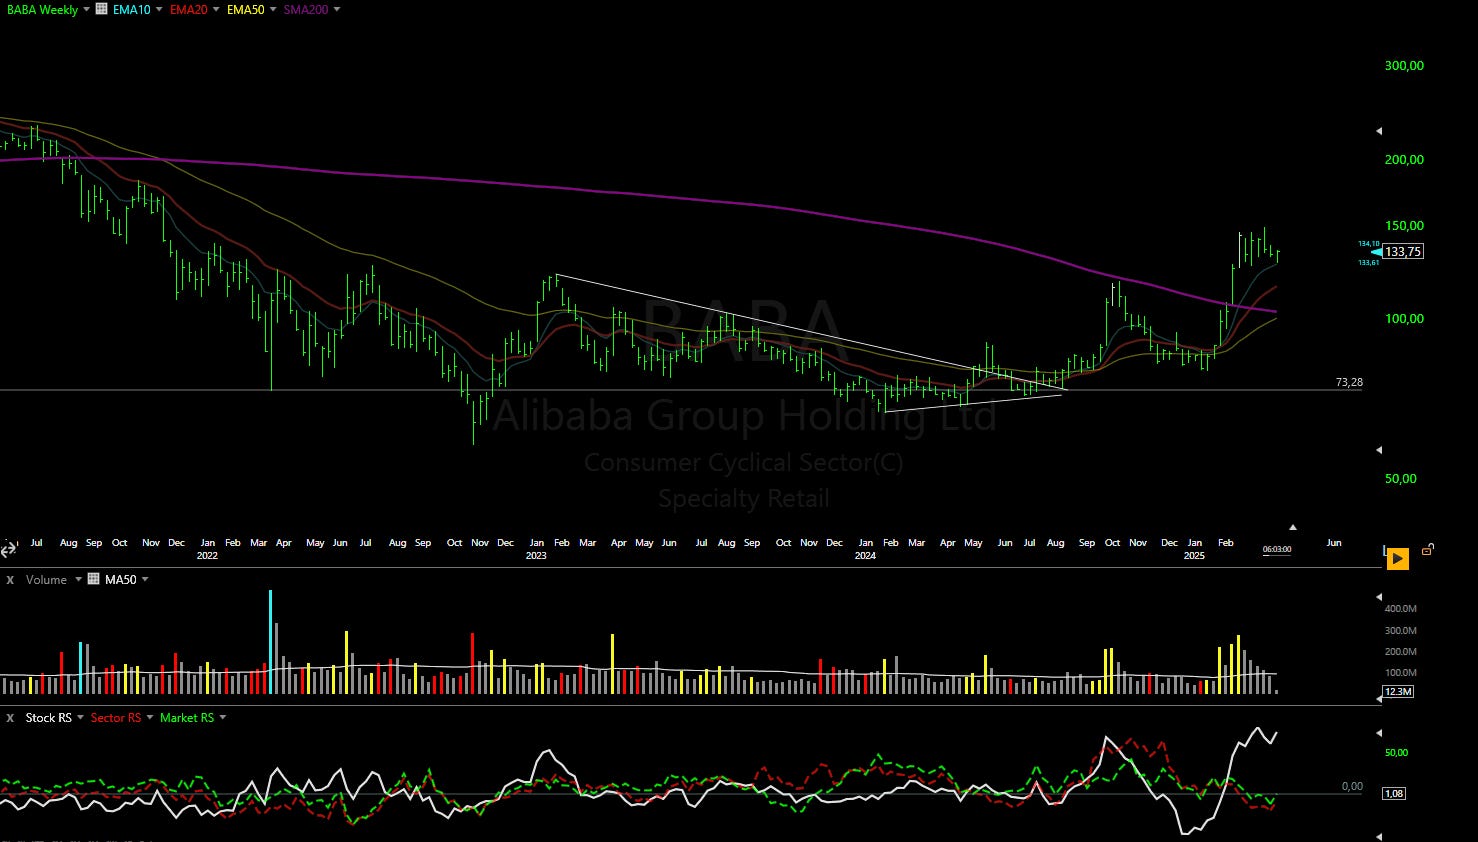
Now, let's shift gears to trend plays, where we're talking about riding waves that take months to develop. This is where LEAPS (Long-term Equity AnticiPation Securities) come into their own. The 12-24 month timeframe isn't just a random number – it's a strategic choice that aligns with how major market trends typically develop.
Take the Chinese stock revival play as an example (2024). This isn't a quick flip – it's a fundamental shift that needs time to mature. January 2026 calls might seem excessive, but they provide something invaluable: the luxury of being right too early. Markets rarely move on our preferred schedule, and the biggest profits often come from having the patience to let a thesis play out.
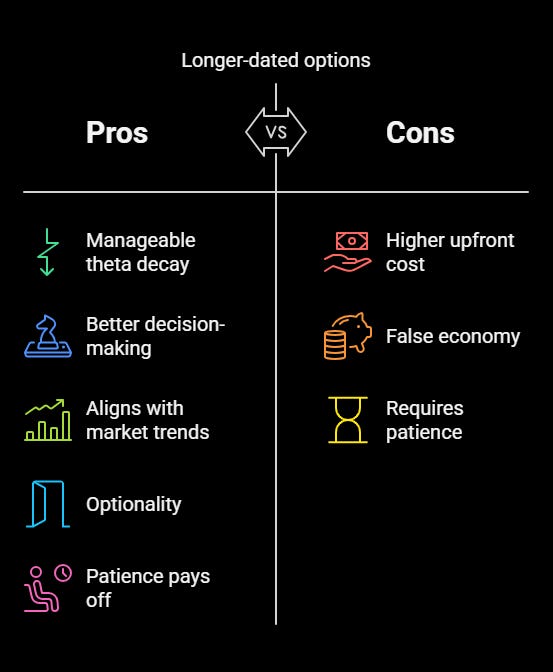
Here's what they don't teach you in trading books: Longer-dated options don't just give you more time – they give you better sleep. When you're not constantly watching theta eat away at your position like a financial termite, you can make clearer decisions. It's the difference between playing chess with a shot clock and playing with ample time to think.
Yes, longer-dated options cost more upfront. This is where many traders balk, opting for cheaper, shorter-dated alternatives. But this is a false economy at its finest. The higher initial cost is paying for optionality – the freedom to be wrong in the short term while still being right in the long term.
The next time someone brags about their weekly options plays, just smile knowingly. They're playing checkers while you're playing chess, and in this game, the longer time horizon often checkmates the short-term gambler.
Strike Selection Strategy
Let's dive deep into the psychology and mathematics of strike selection – arguably the most crucial decision that separates profitable options traders from those who consistently donate to market makers' vacation funds.
When you're orchestrating a swing trade, strike selection becomes a delicate balance between leverage and probability. That zone between At-The-Money (ATM) and slightly Out-of-The-Money (OTM) isn't just a random choice – it's where option mechanics create an optimal combination of risk and reward.
Consider a stock trading at $100. While the siren song of far OTM options (like the $150 strike) might tempt you with their lottery ticket prices, the smart money gravitates toward the $105-$110 range. Why? It's all about Delta, the option's heartbeat.
In this sweet spot, your delta typically ranges from 0.40 to 0.50, meaning your option captures 40-50% of the stock's movement. This is the Goldilocks zone – enough leverage to make the trade worthwhile, but not so far OTM that you're essentially buying lottery tickets with fancy names.
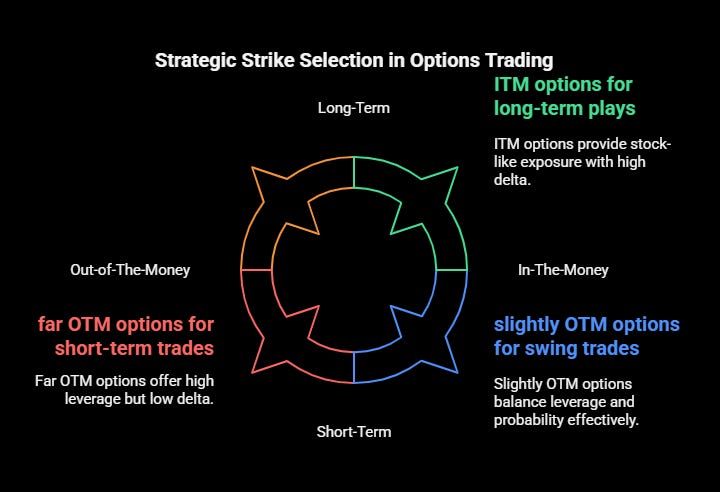
Think of it this way: If the stock moves $5, an option with a 0.45 delta gives you roughly $2.25 of intrinsic value gain. Meanwhile, that tempting far OTM option with a 0.15 delta only captures 75 cents of the move. Sure, the percentage gain might look better on the far OTM option, but that's like comparing apples to lottery tickets.
Now, let's shift gears to longer-term plays, where In-The-Money (ITM) options become your strategic weapon of choice. This isn't about being conservative – it's about being smart with capital deployment over extended timeframes.
ITM options, with their higher deltas (0.70-0.85), essentially give you stock-like movement at a fraction of the capital requirement. Yes, they're more expensive, but in the world of professional trading, "expensive" is relative to the probability of success, not just the absolute dollar cost.
Here's what most retail traders miss: Strike selection isn't just about mathematics – it's about psychology. ITM options for longer-term plays reduce the emotional toll of market volatility. When your delta is 0.80, you're not constantly checking your phone every time the stock hiccups. You're essentially getting stock-like exposure without tying up stock-like capital.
Consider this: Market makers price options based on probability and risk. When you buy far OTM options, you're essentially betting against their mathematical models. But when you select strikes strategically – slightly OTM for swings, ITM for longer plays – you're aligning yourself with probability rather than fighting against it.
The Quick Options Pricing Hack
Here's how to know if you're overpaying:
Check the stock's ADR (Average Daily Range)
Calculate the option's implied move vs. ADR
Example:
Stock ADR = $2
Option premium = $3
Strike needs a $5 move to break even
If this needs to happen in 5 days, you're fighting the odds
If you have 60 days, now we're talking
Position Sizing with Options:
Never risk more than you can lose entirely
Options position size = What you'd risk on stock ÷ 3
Example: If you'd risk $3000 on a stock position, use $1000 for options
Market Timing
Remember that friend who checks their weather app every 5 minutes during a sunny day? That's how most traders approach the market - obsessing over every tick while missing the storms that matter. Let's change that narrative.
The market operates as a complex, interconnected system where understanding the broader picture is more crucial than tracking individual components. Much like how key health indicators can reveal your overall wellness, three fundamental market measures can provide a clear view of market conditions: The QQQ, tracking technology and growth sectors; the SPY, measuring overall market performance; and the IWM, representing small-cap stocks - often the first to signal significant market shifts.
Capital flow in markets follows a predictable pattern of sector rotation, moving from one area of opportunity to another based on economic cycles, market conditions, and investor sentiment. As we observe in the current environment, energy stocks are showing remarkable strength while technology experiences a cooling period. Simultaneously, we're seeing significant movements in Chinese recovery-focused investments, while healthcare insurance and select pharmaceutical companies demonstrate notable momentum. This pattern of capital movement provides valuable insights into market dynamics and potential opportunities.
The Golden Windows Theory
Here's the secret most day traders don't want to hear: There are only 2-3 major "windows" each year where making money is like shooting fish in a barrel. The rest? It's mostly chop that will eat your account alive.
These distinct windows of opportunity aren't random occurrences but rather the result of powerful market forces aligning when multiple factors converge: institutional capital deployment, clear sector rotation, strong market sentiment, and often, macroeconomic catalysts.
During these periods, which typically last 2-6 weeks, market direction becomes more predictable, volatility becomes more manageable, and trading setups work with higher probability. Think of earnings seasons coinciding with positive economic data or major policy shifts aligning with strong sectoral movements.
Want to spot these golden windows? Watch for the triple alignment: major indexes above their 20 MA and rising, small caps flexing, and VIX under 20.
The reason for this pattern lies in the market structure itself. Markets spend roughly 70-80% of their time in consolidation or choppy conditions, where price action is dominated by algorithmic trading, short-term program trading, and the absence of strong directional conviction from major institutions. During these periods, false breakouts are common, and even seemingly strong setups can fail unexpectedly.
Understanding this rhythm is crucial for capital preservation. During the non-optimal periods, successful traders typically reduce position sizes, trade less frequently, or remain in cash - recognizing that forcing trades in choppy markets is a primary cause of account deterioration. The key to long-term success isn't about maximizing trading frequency but rather about preserving capital during quiet periods while being positioned aggressively when genuine opportunities present themselves.
The market rewards neither the most complex strategies nor the boldest predictions, but rather the most consistent application of sound principles. Your journey in swing trading should lead you not to more indicators or more sophisticated patterns but to a deeper understanding of price action and market behavior. The most successful traders aren't those who know the most but those who effectively apply what they know.
In the end, successful swing trading comes down to three fundamental principles: respect your technical analysis, manage your risk religiously, and never forget that markets are cyclical. The tools and patterns we've discussed are your framework, but your success will ultimately depend on your ability to remain objective, disciplined, and patient.
The market will always offer opportunities – your job is to be ready when they appear and wise enough to step aside when they don't.
 | A guest post by
|
Excellent post! One question: In reference to golden windows, should "small caps flexing" be judged by IWM outperforming SPY?
I didn’t quite get the options price hack, can you ELI5? Maybe show the formula of how to determine that the stock needed a 5 dollar move to break even is it really just the option premium+ADR? Thanks