


⭐️ The Stock Arbitrage Scanner Is Here!
It's time.

To Smart Investors,
If you are a paying subscriber or a lifetime subscriber, go to:
!!! WE HAVE A PROBLEM WITH MOBILE LOGINS. PLEASE USE ON DESKTOP UNTIL WE HAVE A FIX IN PLACE. WORKING ON IT ASAP.
Log in with the Substack email used to subscribe to this newsletter. No password is necessary.
We are using a magic email link or a passcode that you will receive to your email.
If you’re not a subscriber, you can sign up here:
Why This Is Revolutionary:
Over the last 12 years, from May 9, 2013, to May 9, 2025, the SPDR S&P 500 ETF Trust (SPY) achieved a cumulative total return of approximately 242%, assuming dividends were reinvested.
This equates to a compound annual growth rate (CAGR) of about 10.5%.
Investing $100,000 in SPY on May 9, 2013, would have grown to approximately $342,000 by May 9, 2025, assuming dividends were reinvested.
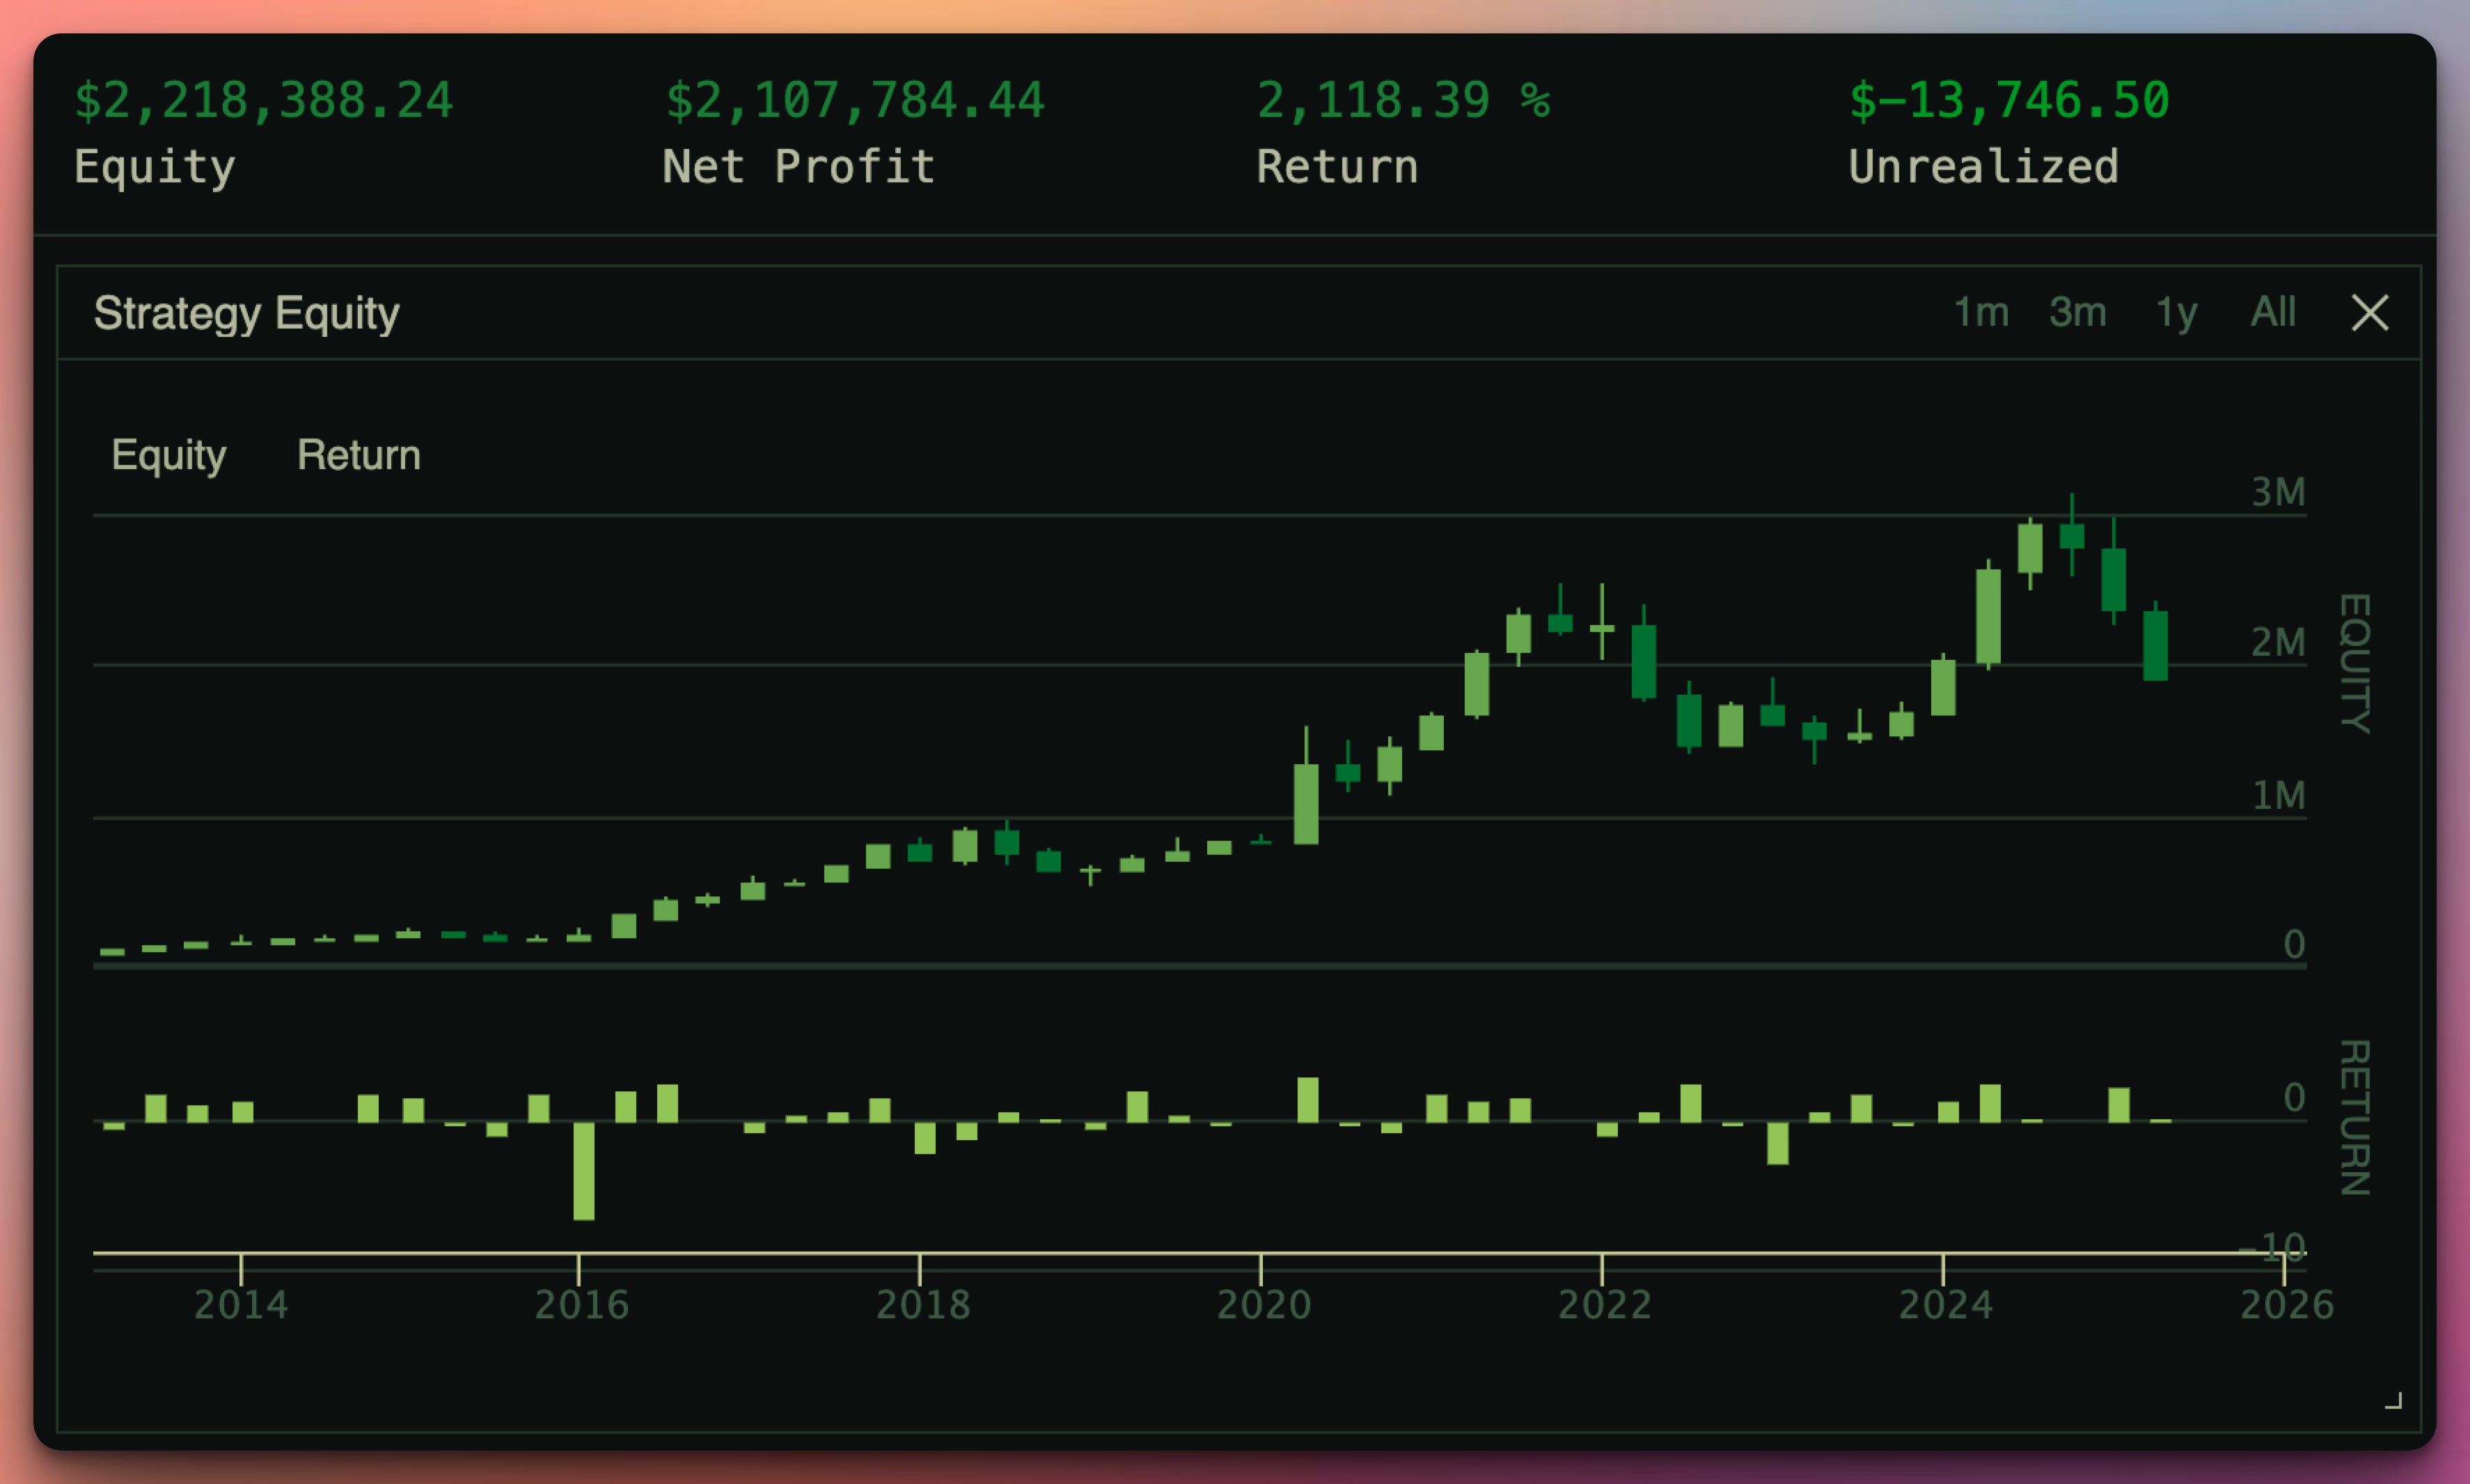
My algorithm made 2,118.39% over the same time period. Starting with $100k, ending with $2,218,388.24:
How To Log In:
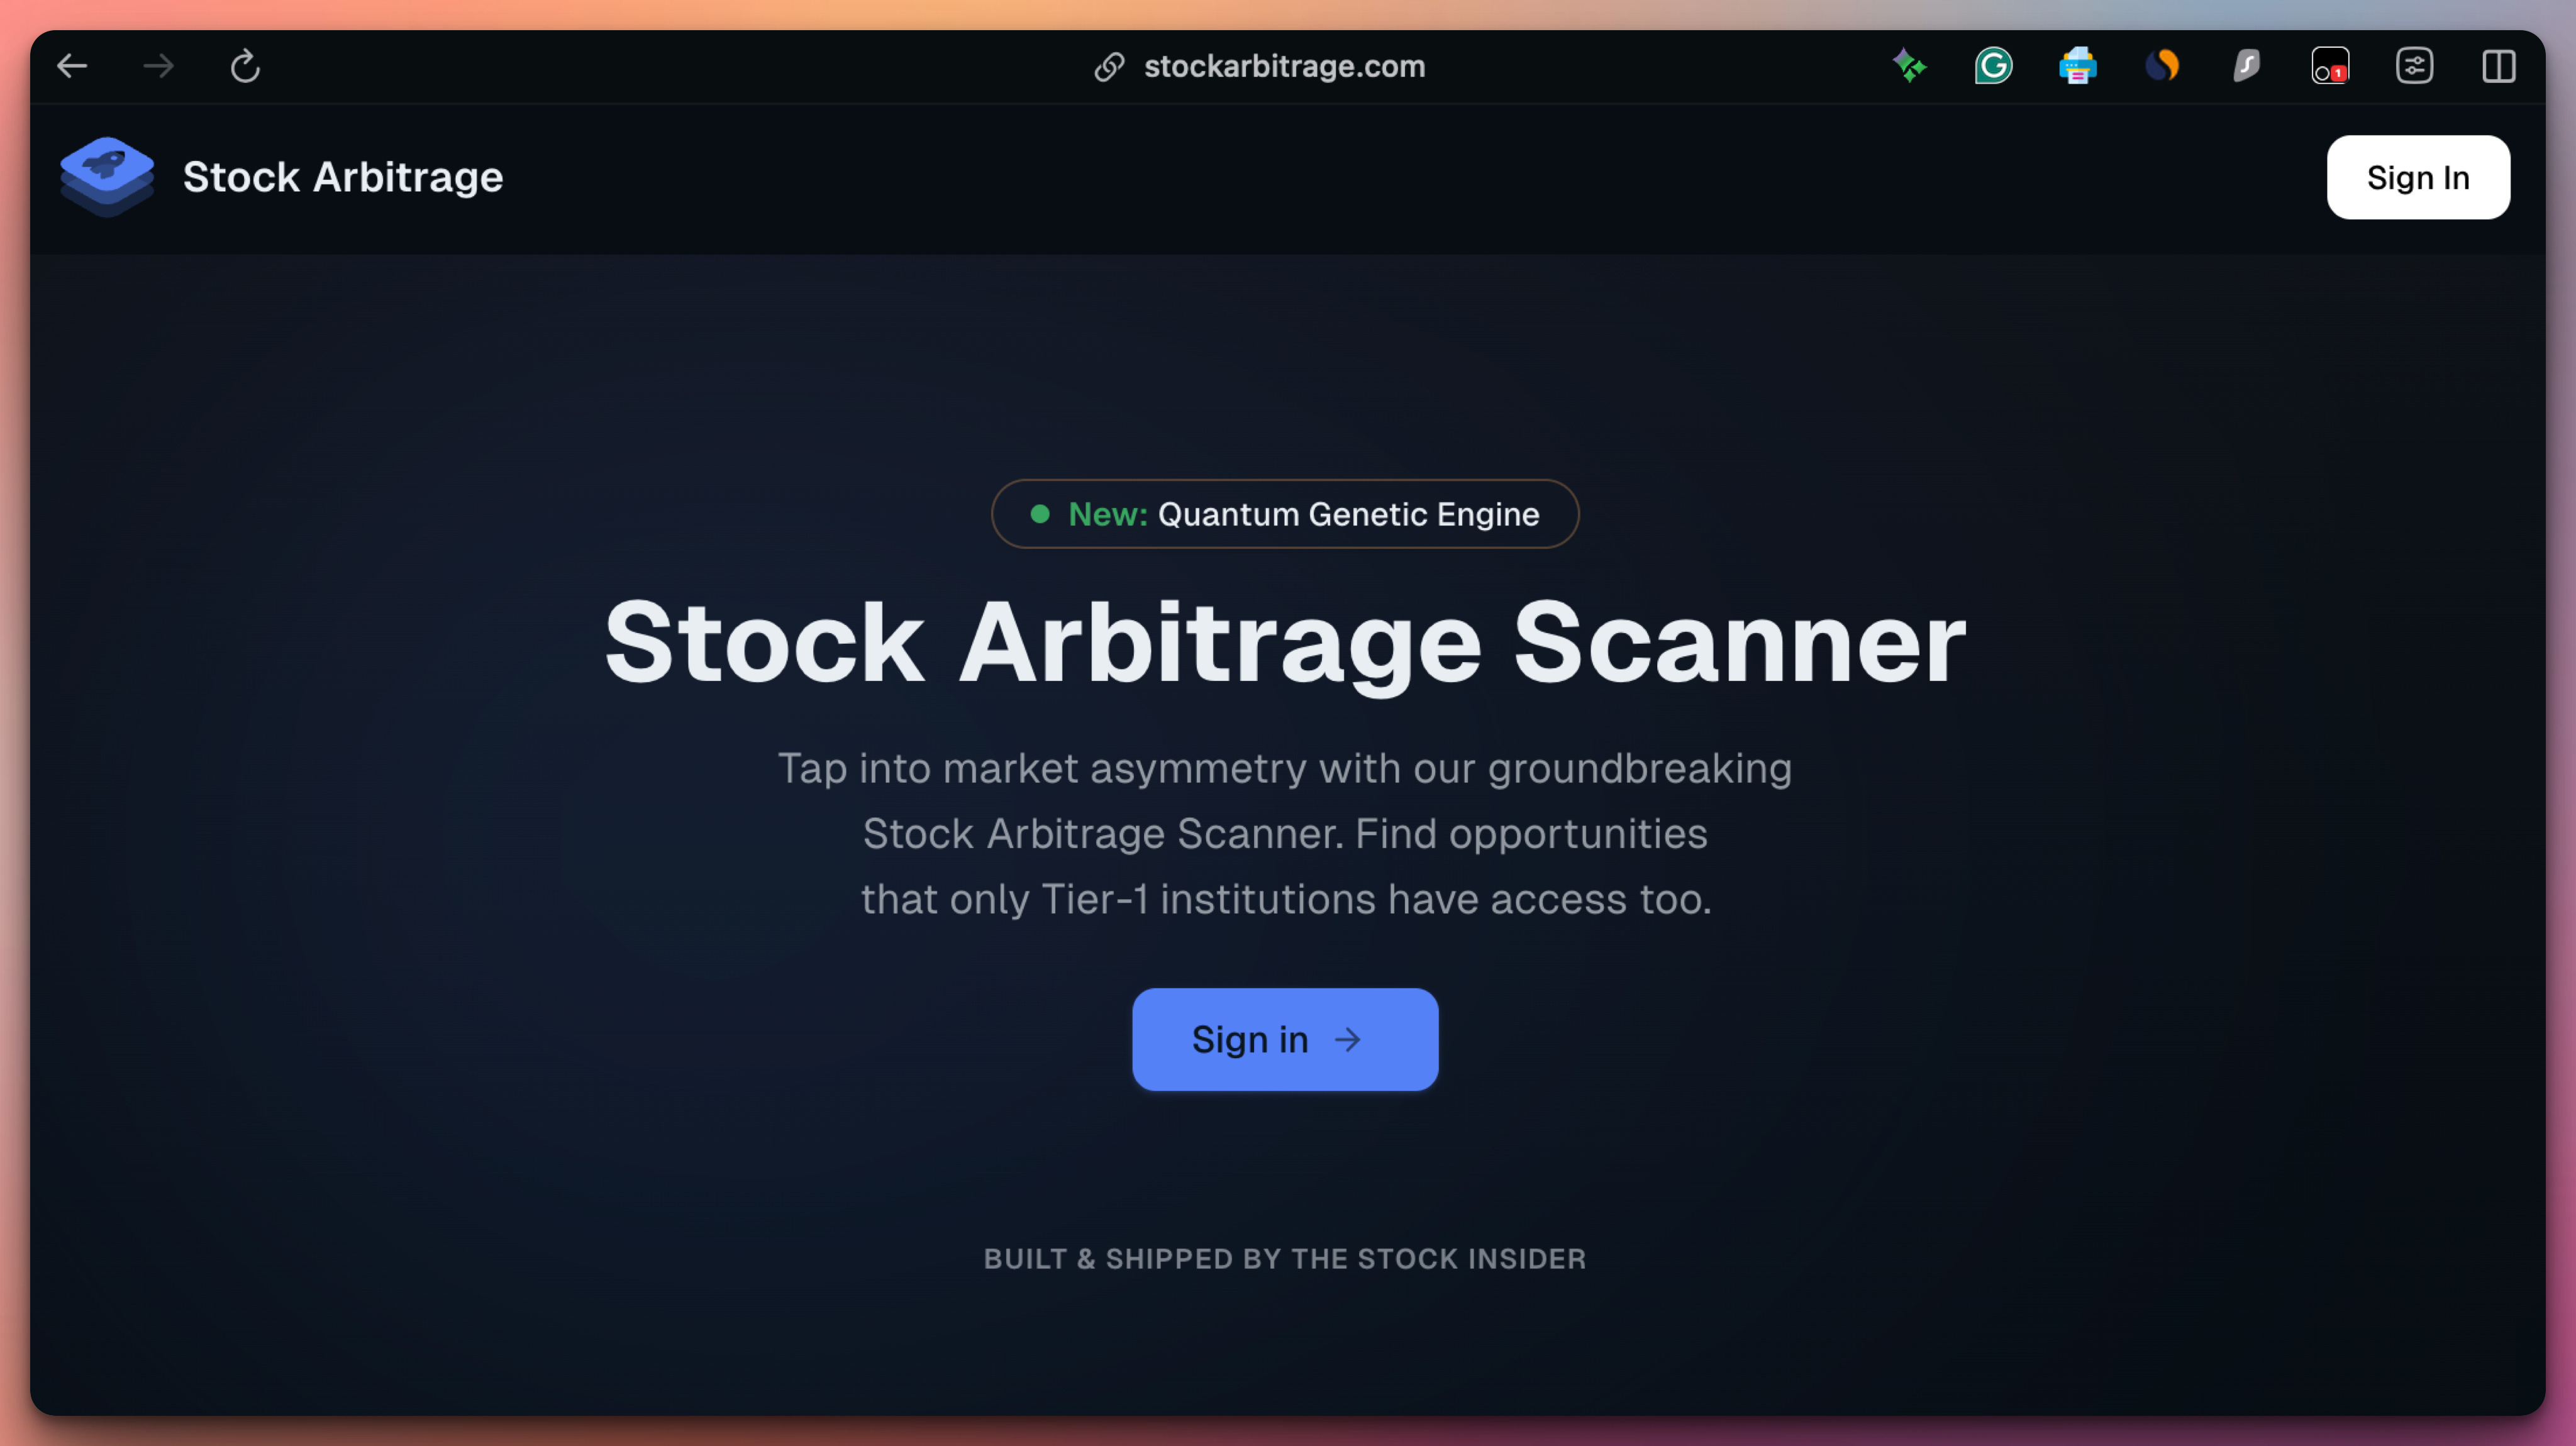
Go to the website and click any Sign In button:
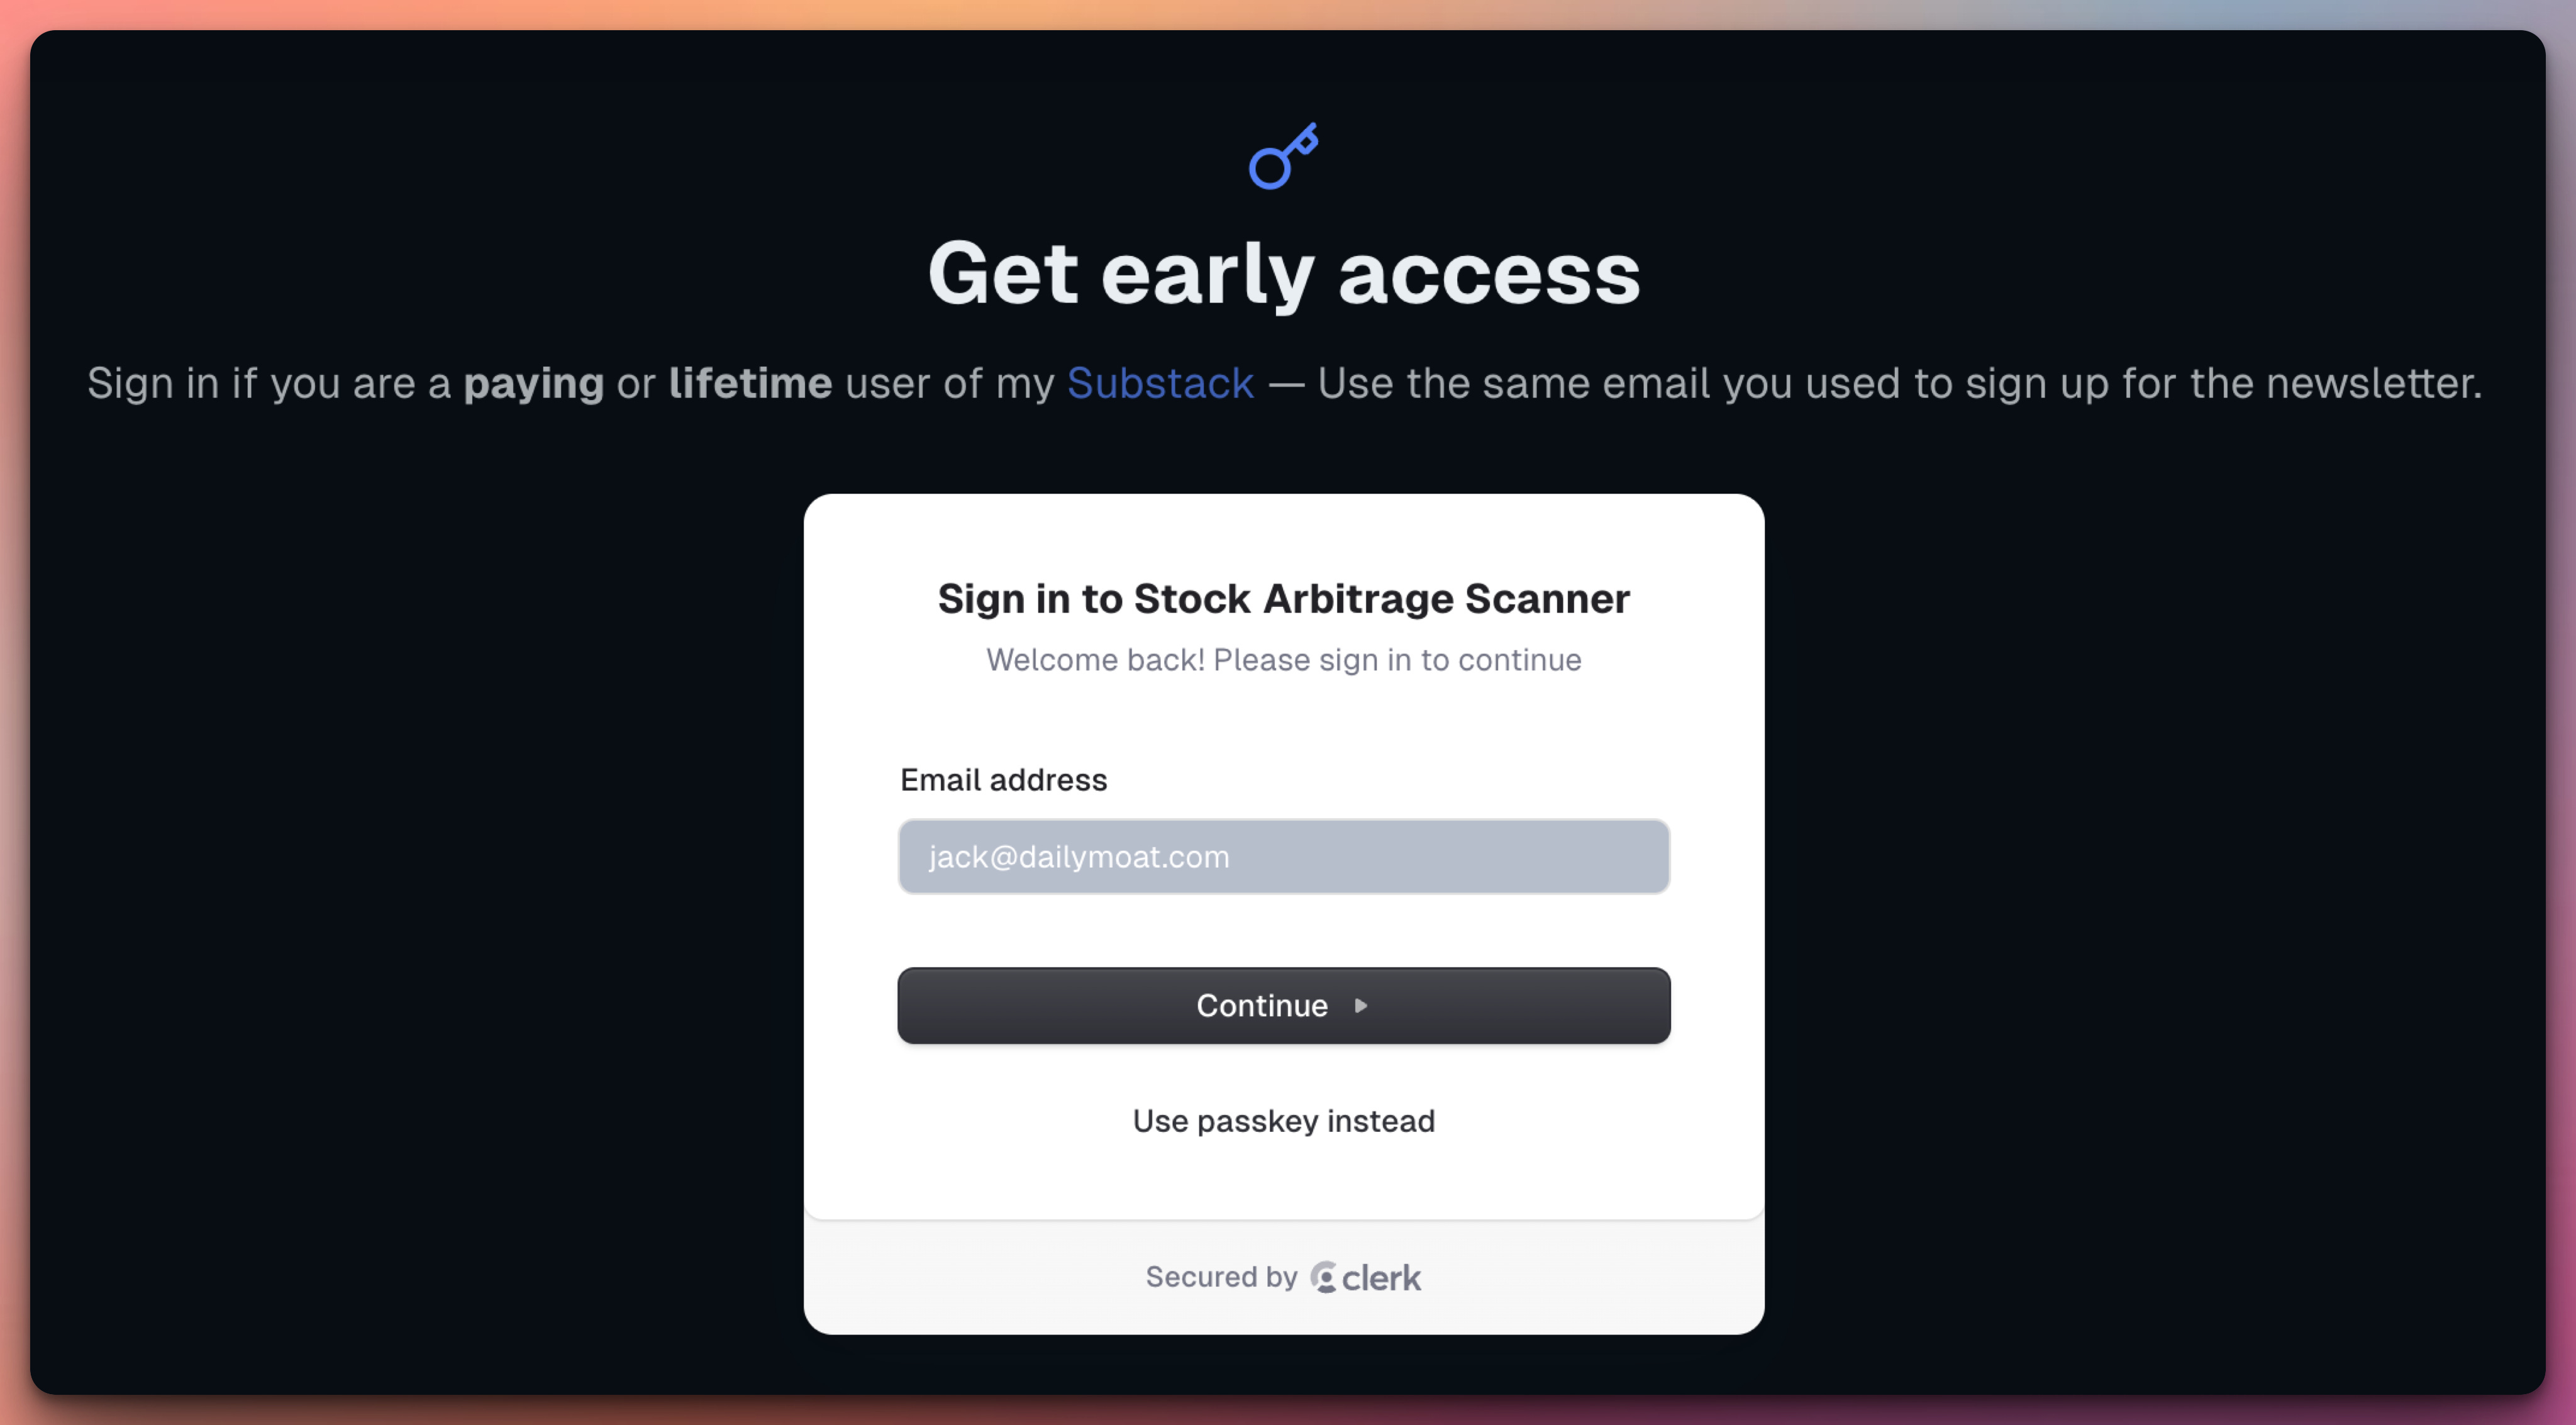
Then you will see this form where you have to put your Substack email:
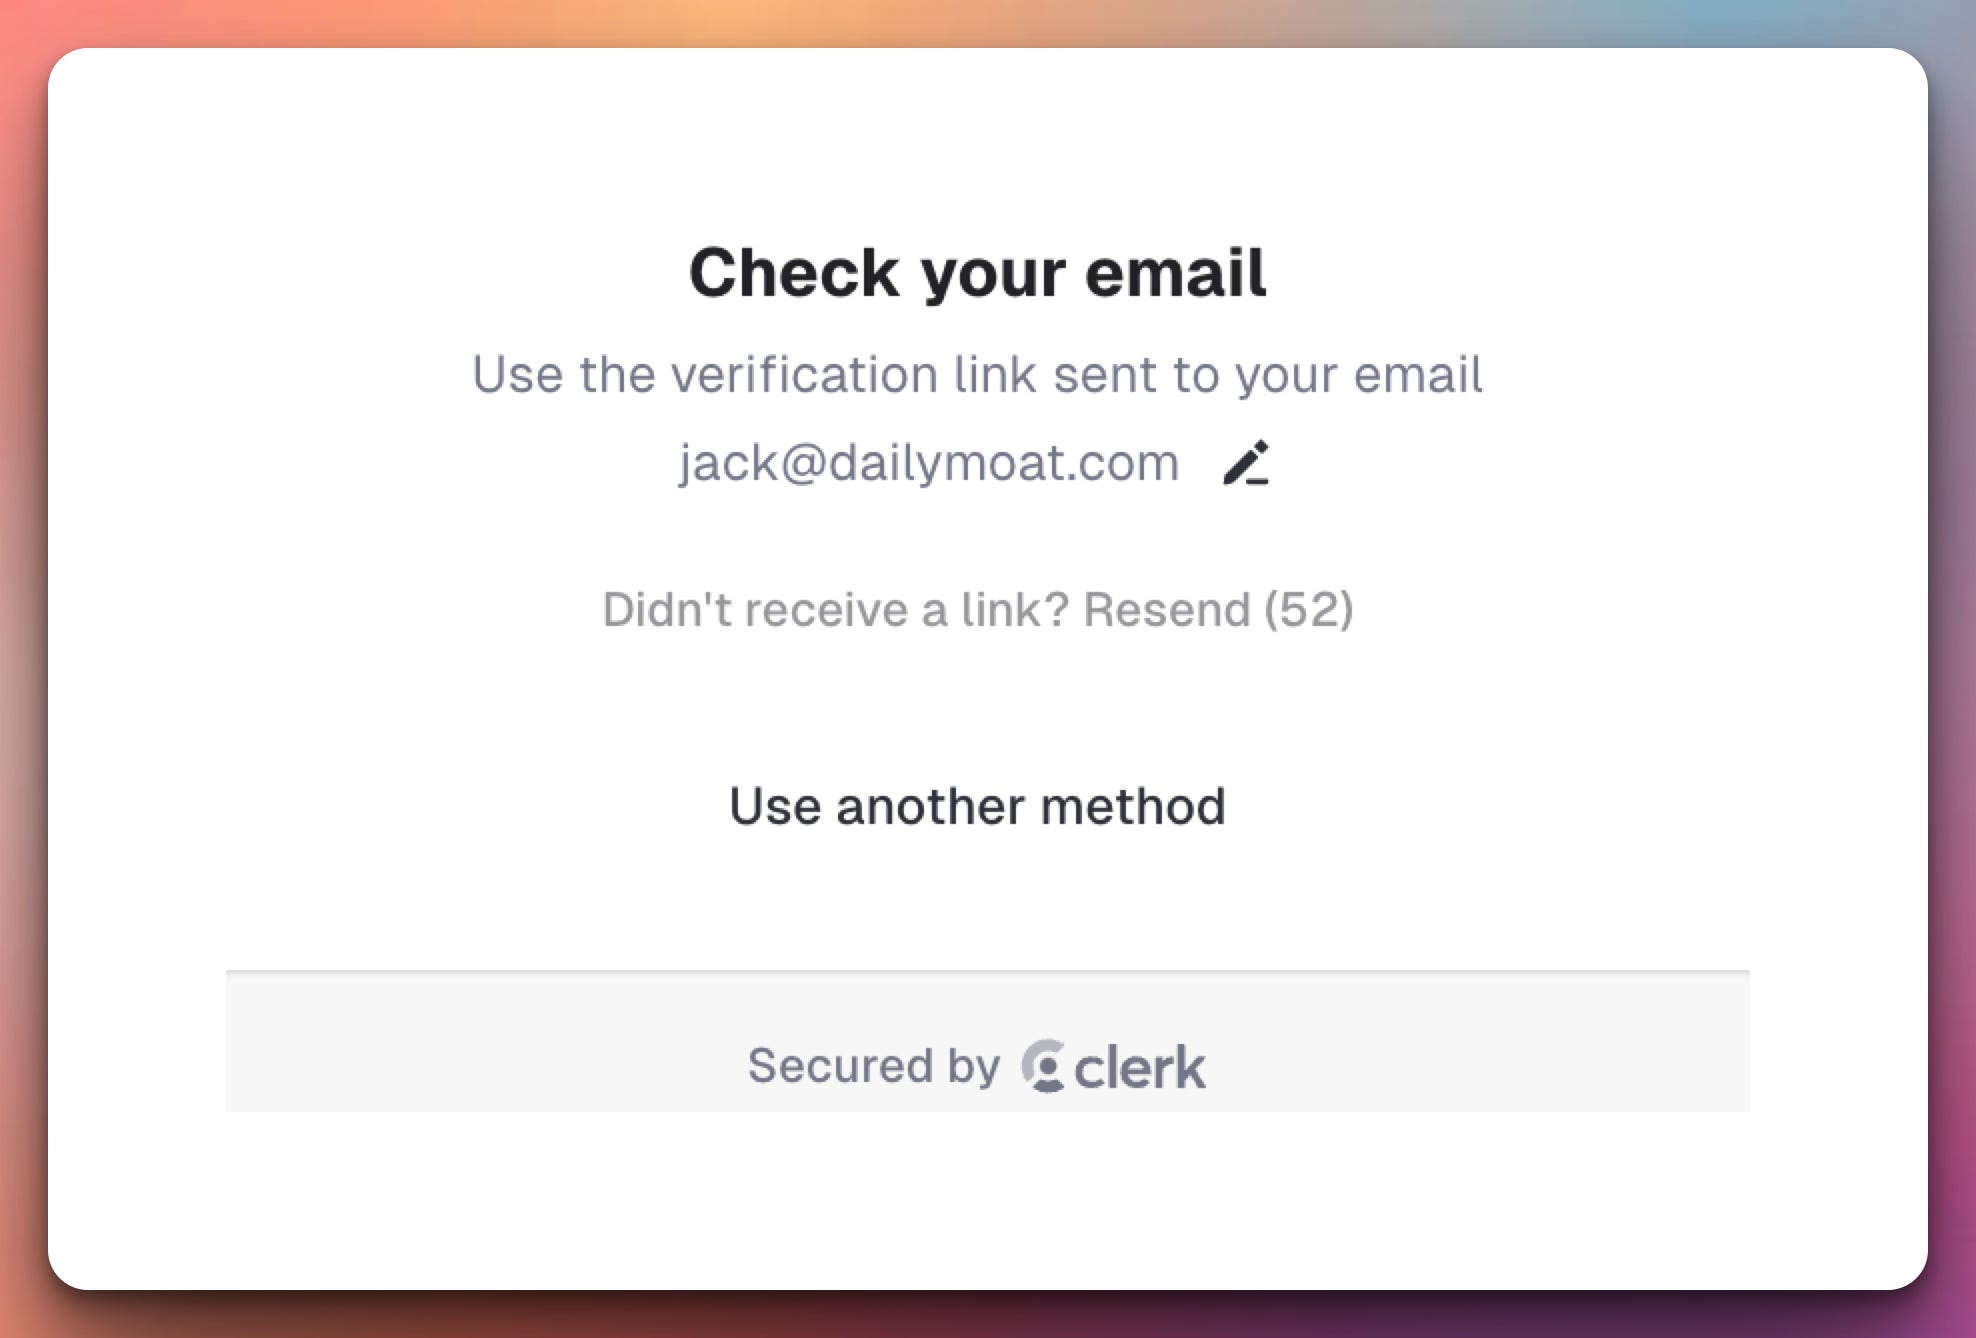
Click Continue and check your email:
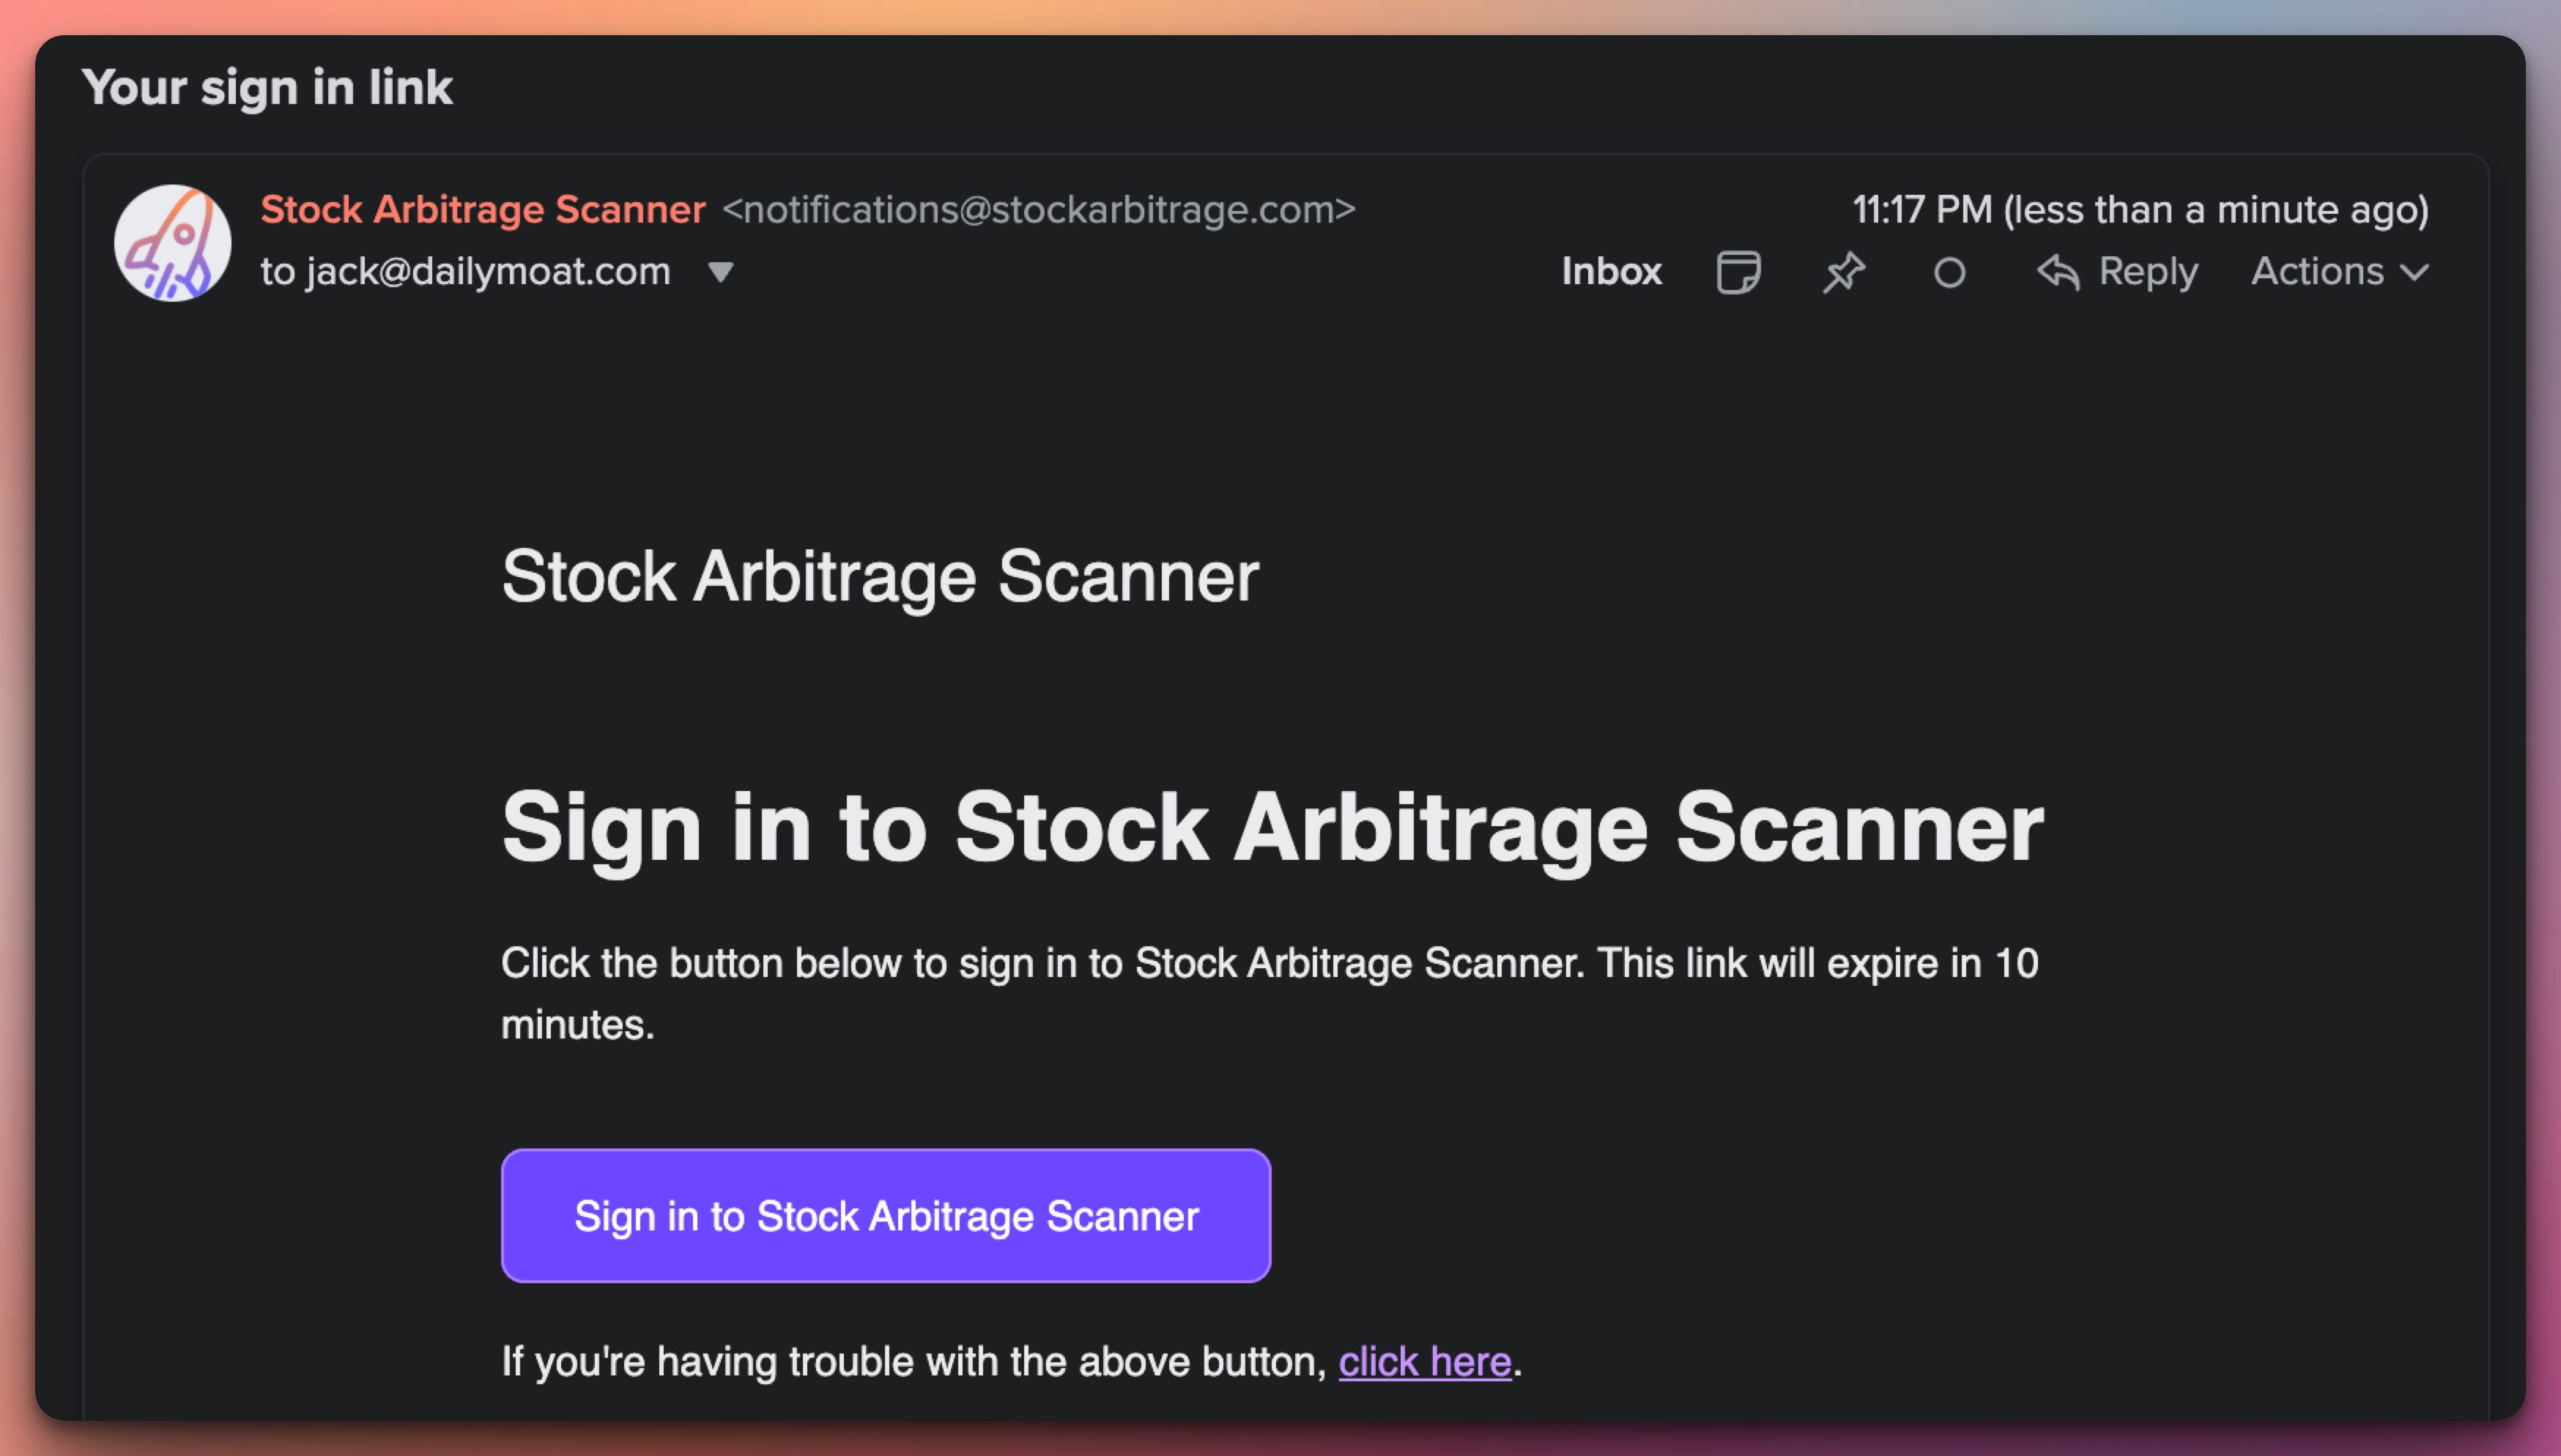
Click on Sign In, and you’re good to go. You can log in on several devices that you own, but because there is a lot of data in some tables, this works best on laptops, desktops, or tablets. Mobile devices are supported, but I definitely prefer viewing the data on my Mac.
The Most Important Part
I’ve been coding this app for the last 3 month, implementing the methods that I use for trading.
All of the data is updated every day.
Now we have a strong framework and it’s stupid easy to add new functionality every week.
Today, we are starting with 4 tools:
The Options Scanner
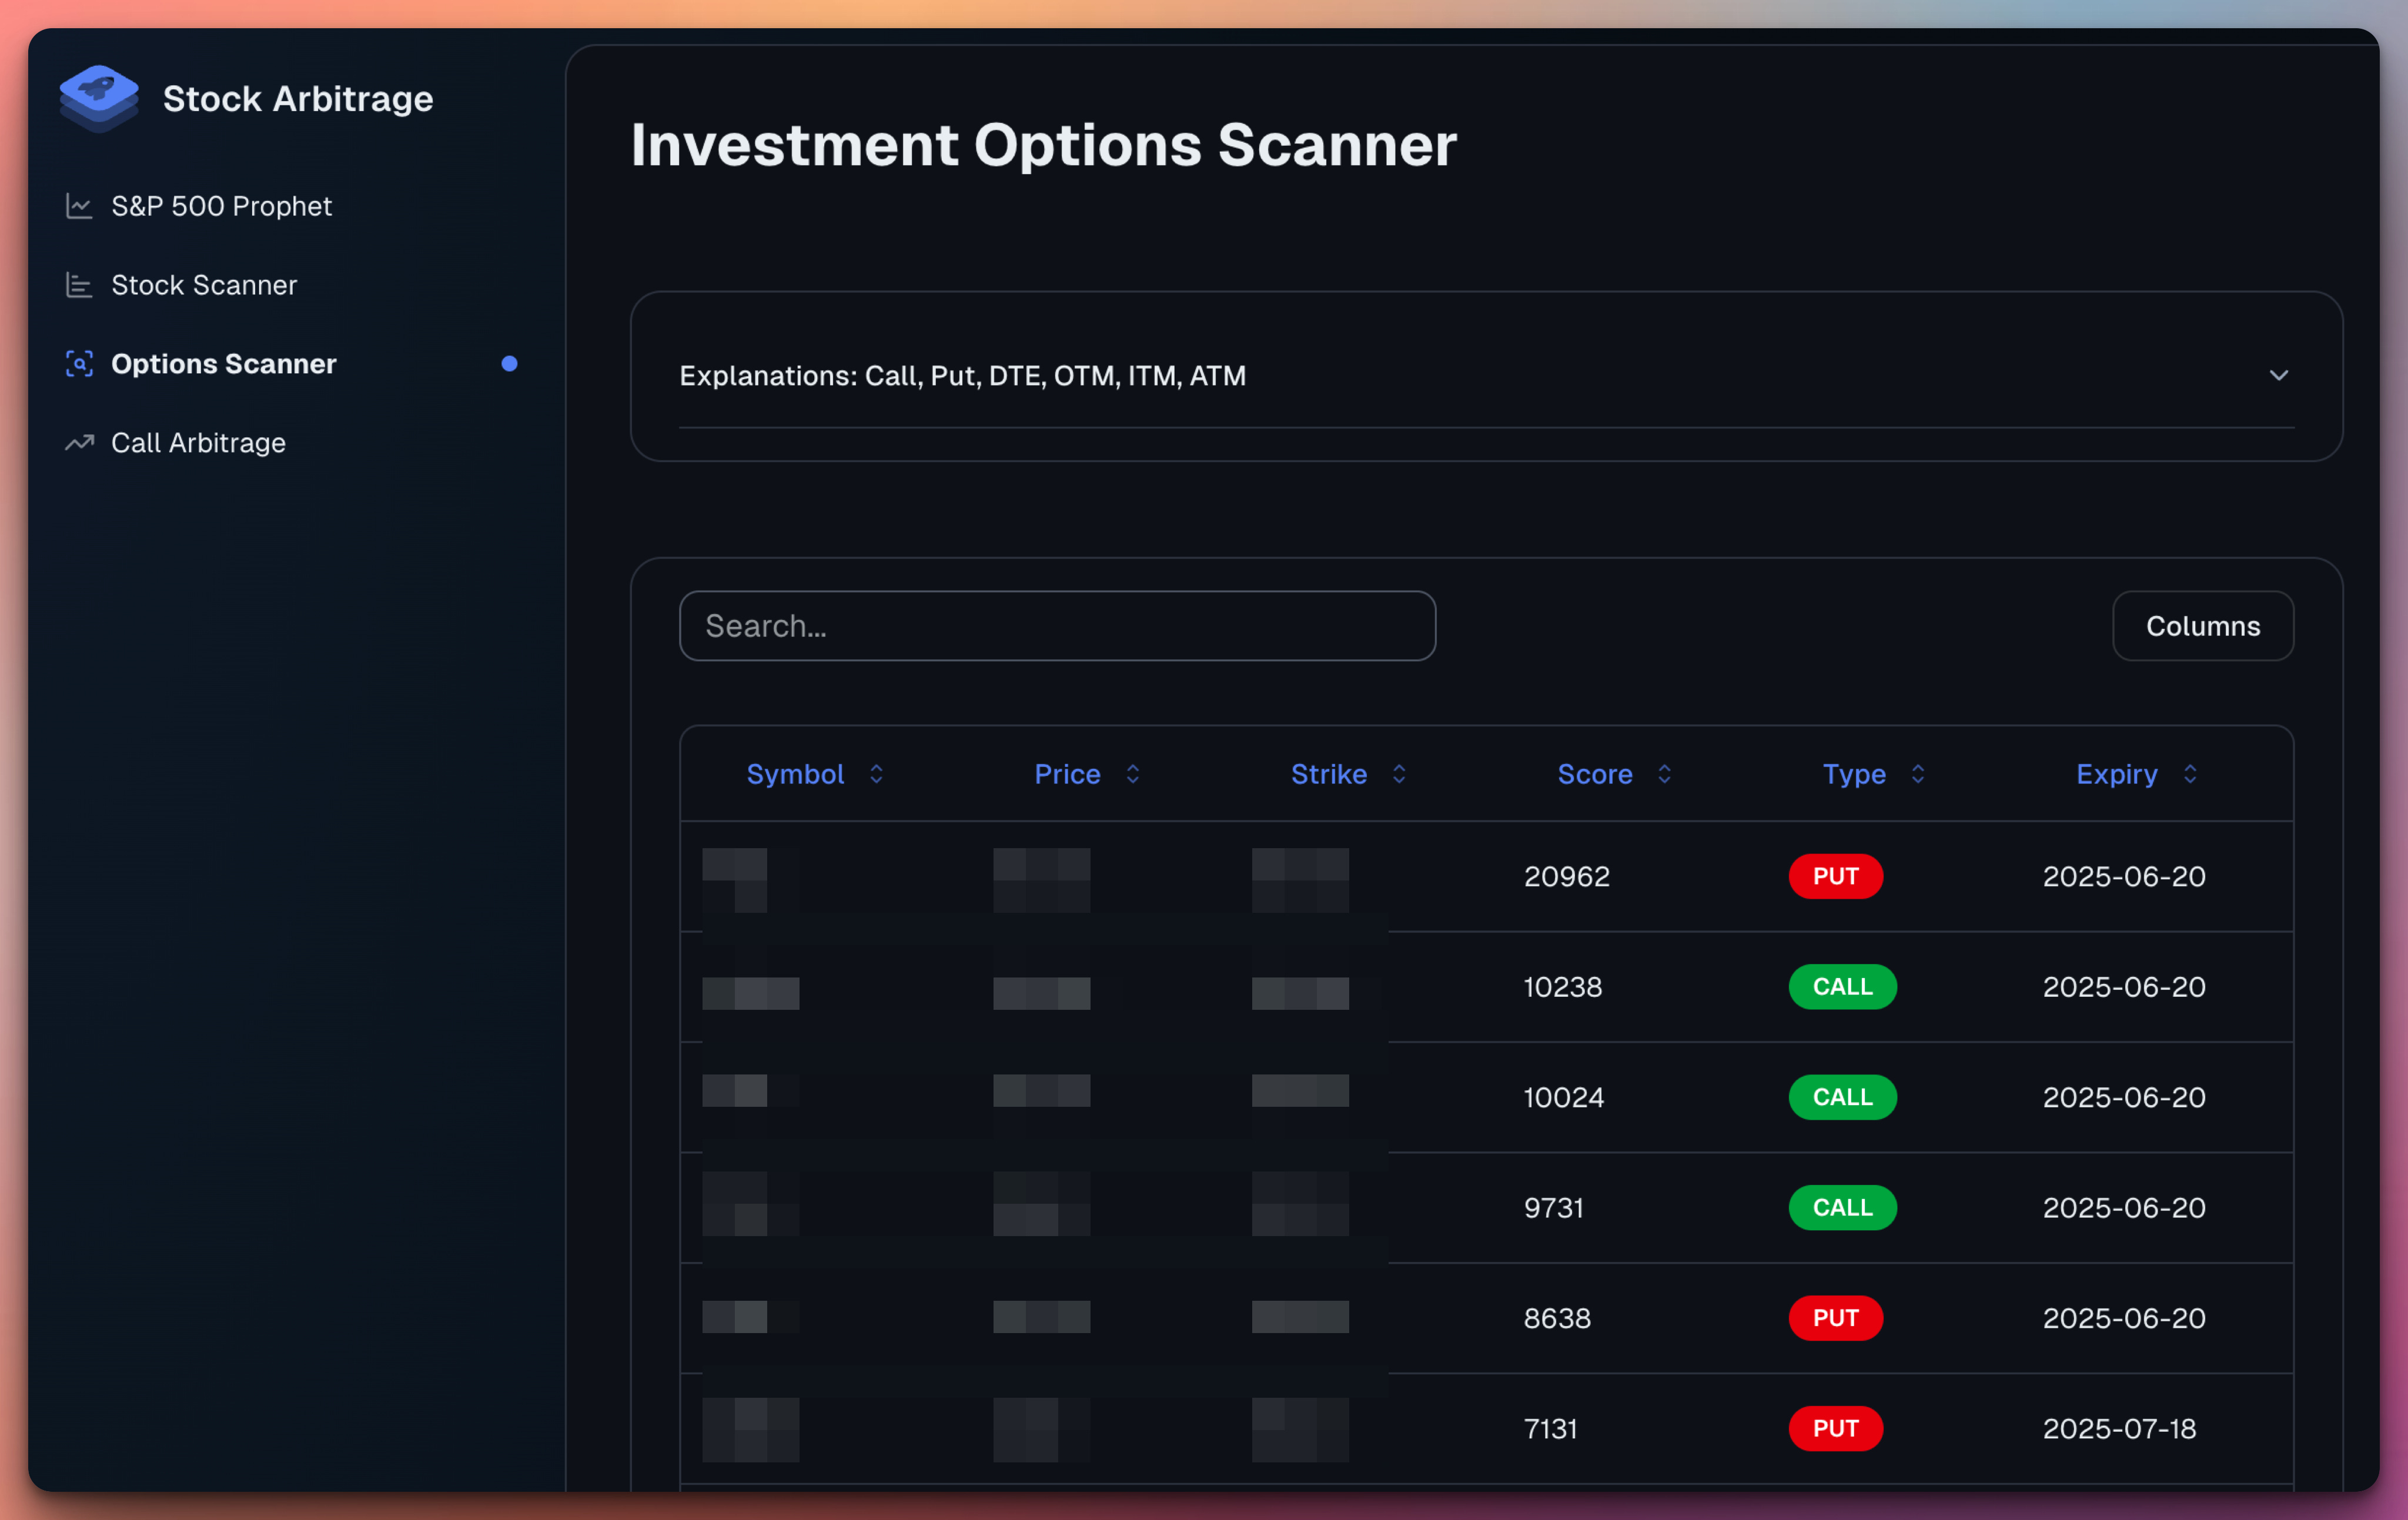
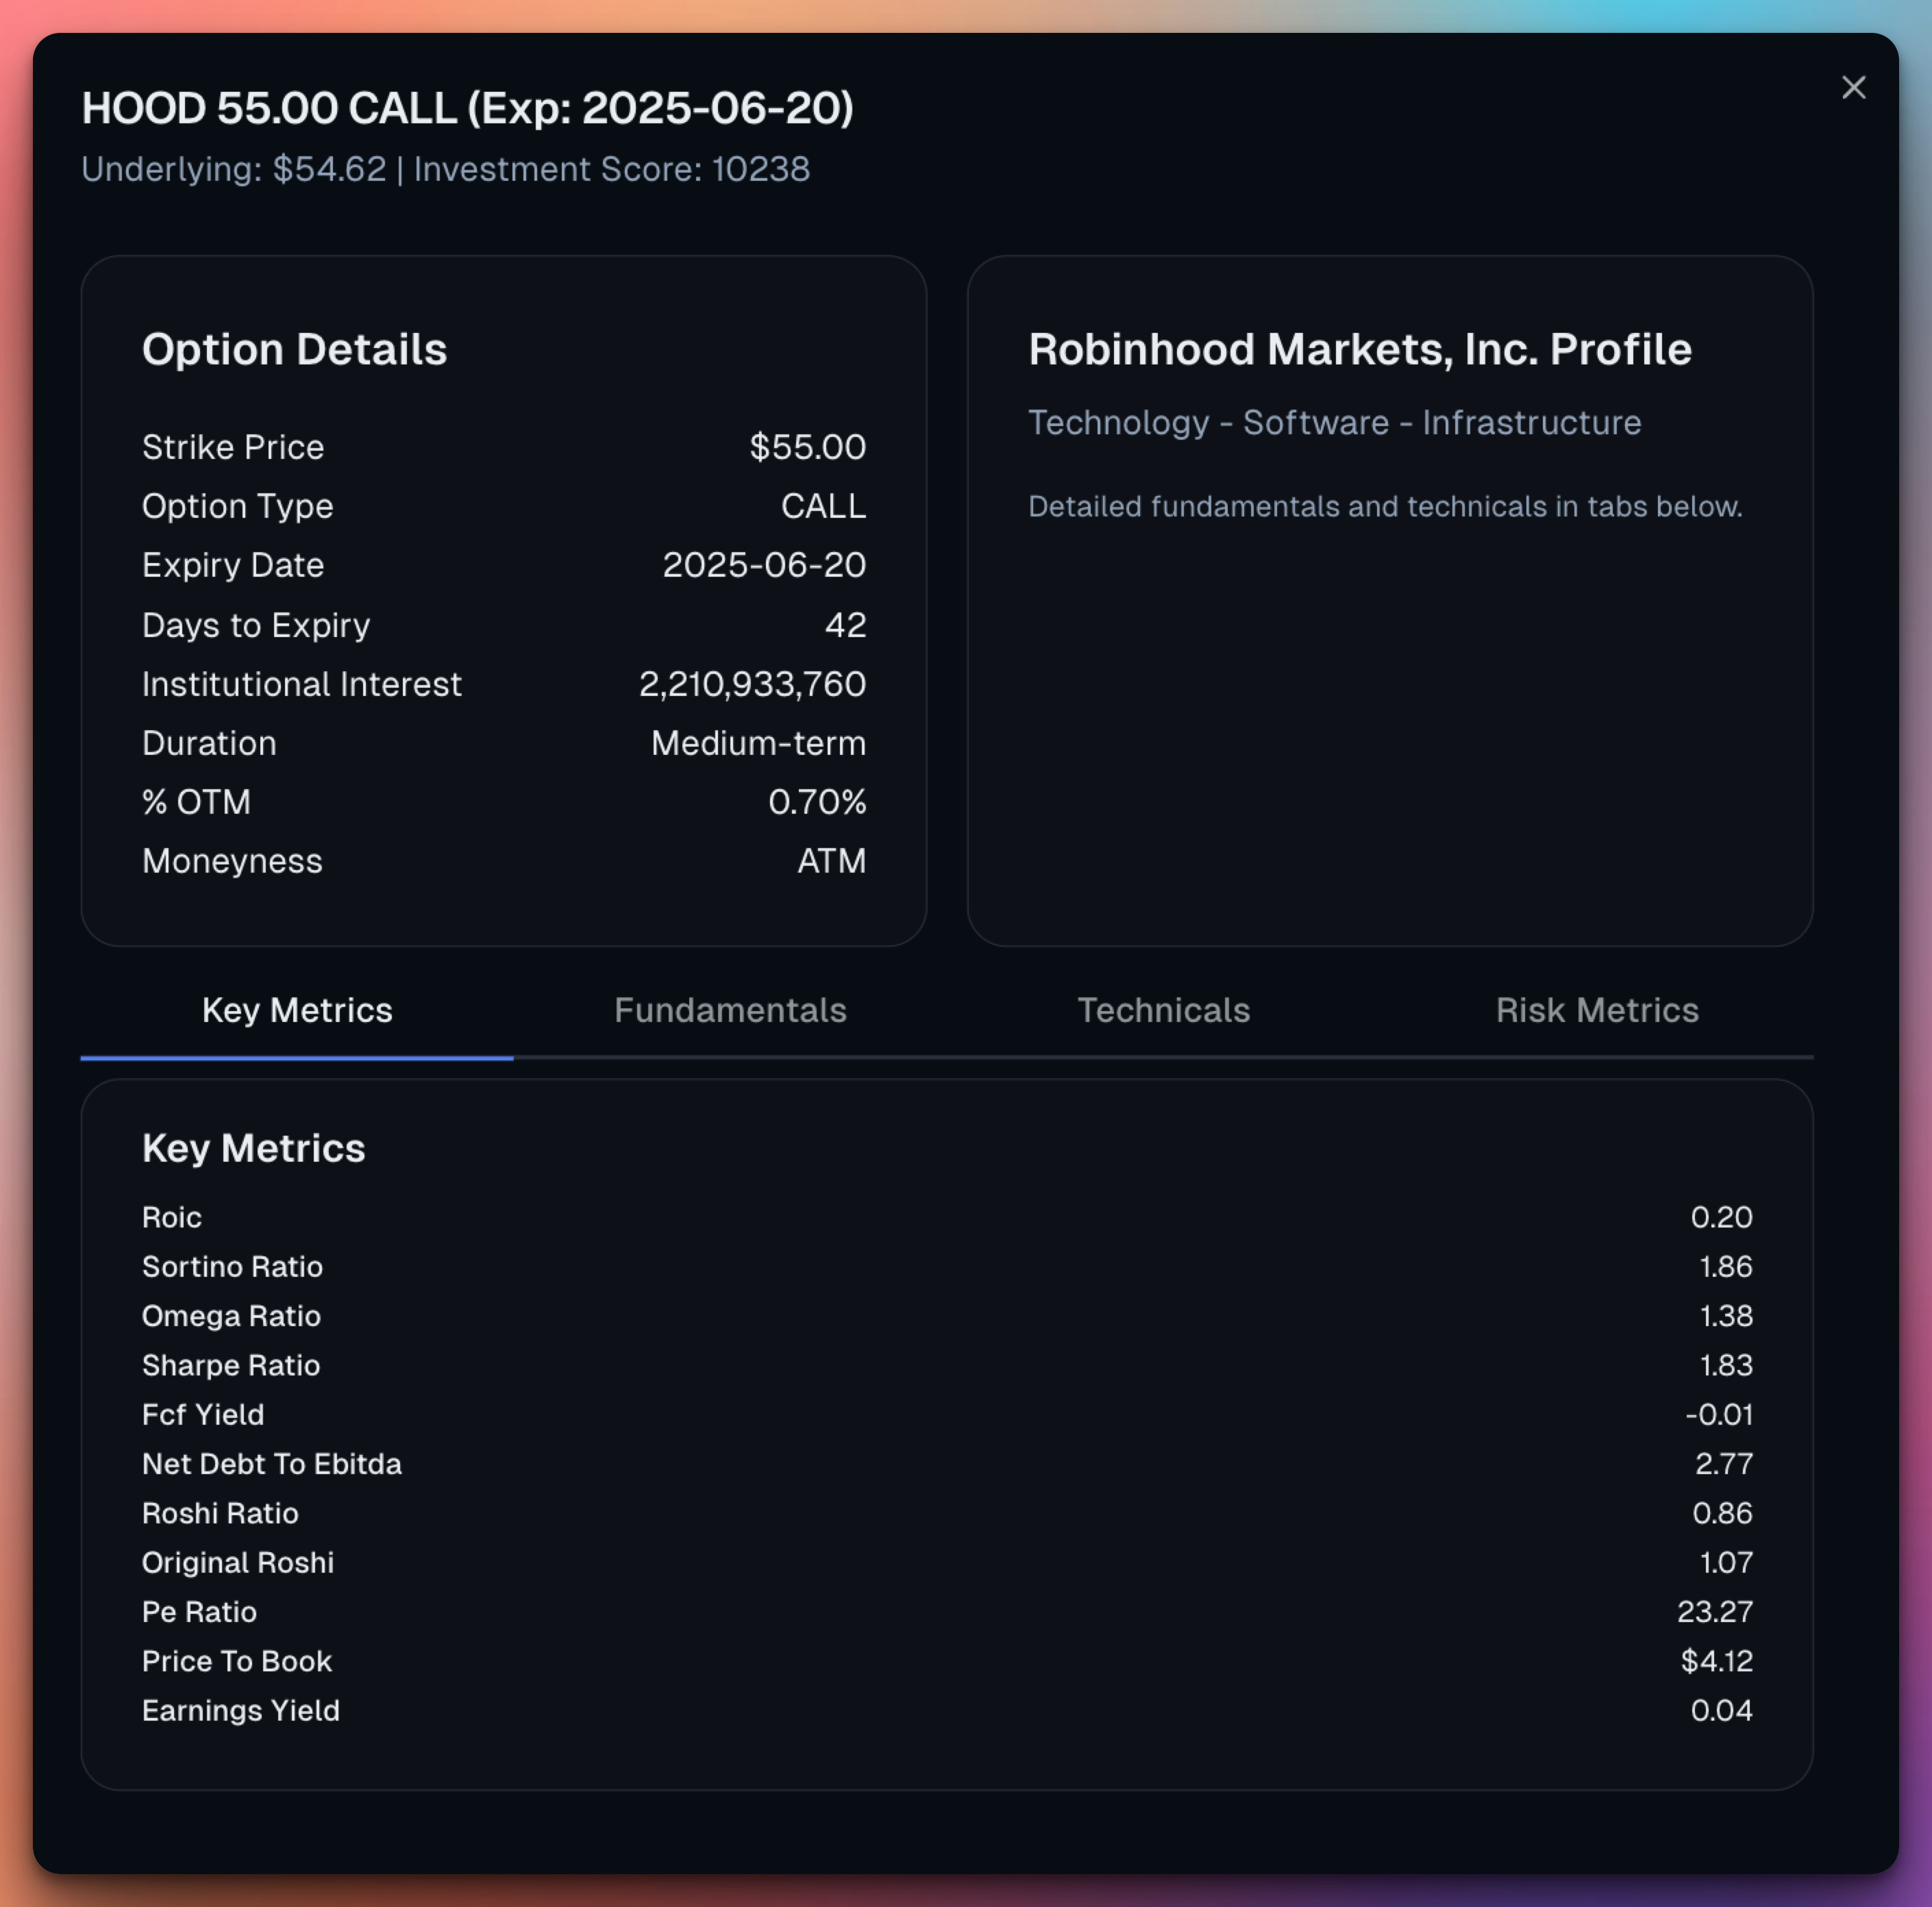
Options are sorted by Score, representing the highest probability of success and institutional interest.
If you click on a particular company, you can see very detailed fundamental and price action metrics:
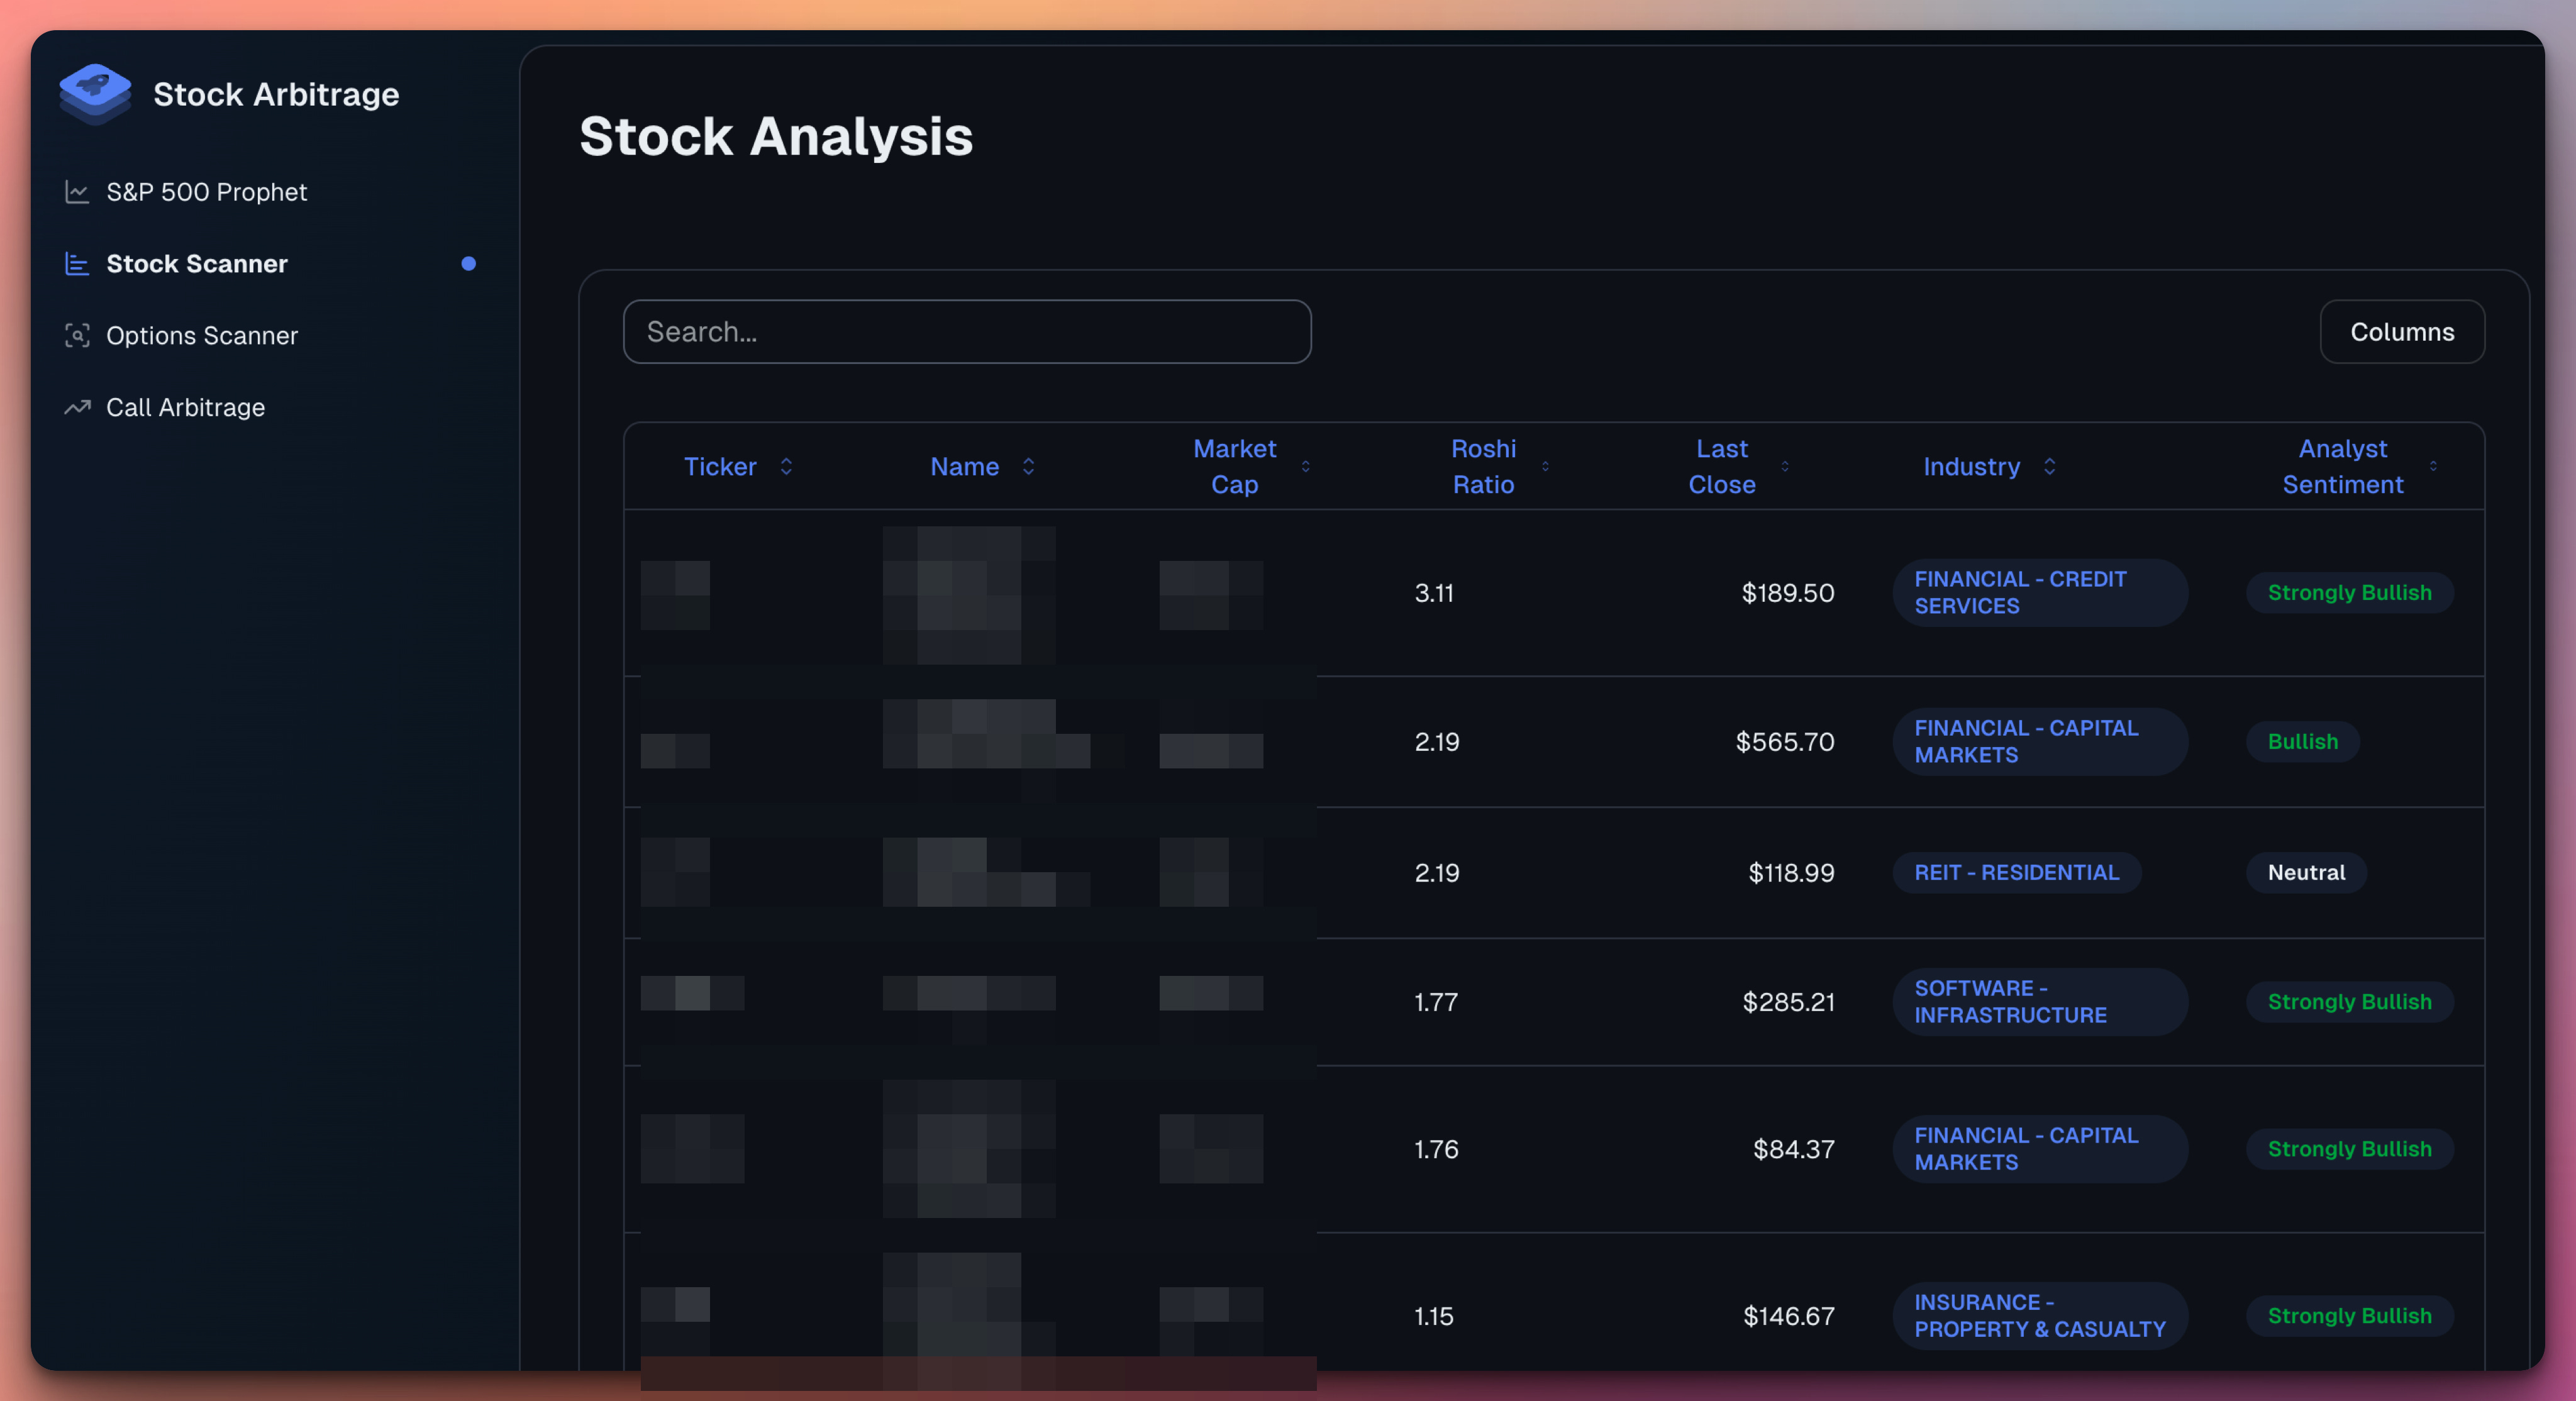
Stock Scanner
This is my main tool.
Stocks are sorted by the Roshi Ratio, a complex indicator that is constantly adapting and finding undervalued companies.
This is for swing trading.
Covered Calls
This is for experts only with big portfolios $100k+.
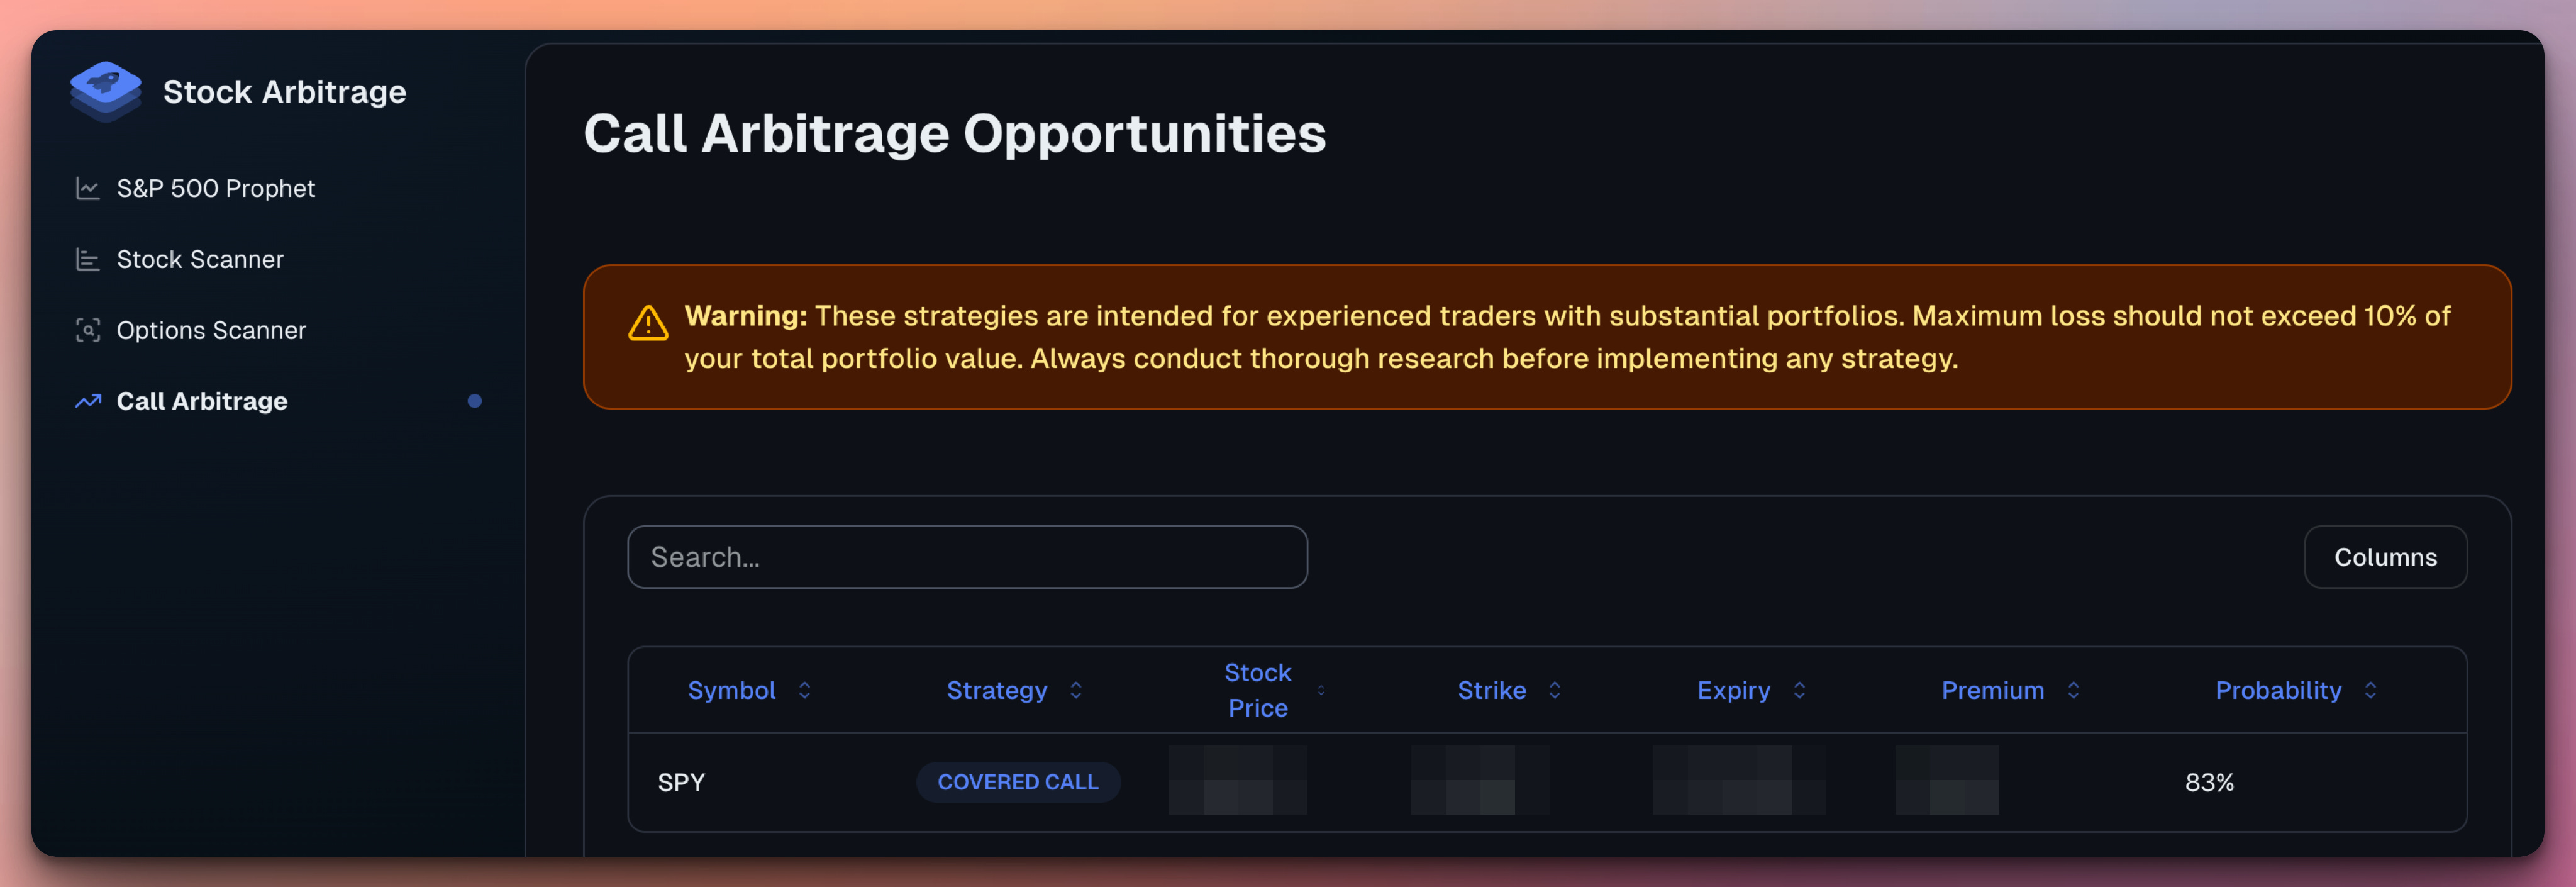
Today we have only 1 Covered Call with a high probability, but usually there will be anywhere between 2-5.
These are long-term options and LEAPs. Big money stuff.
And finally, the most critical part…
The SPY Prophet
I apologize to anyone offended by the name “Prophet,” but we heavily use the Facebook Prophet here.
Ok. So this is revolutionary.
I have access to certain institutional data.
When Trump announced the tariffs in April, the stock market tanked almost 15% in 3 days.
No kind of analysis could have predicted this exactly.
So why were the institutions shorting SPY exactly days before this happened?
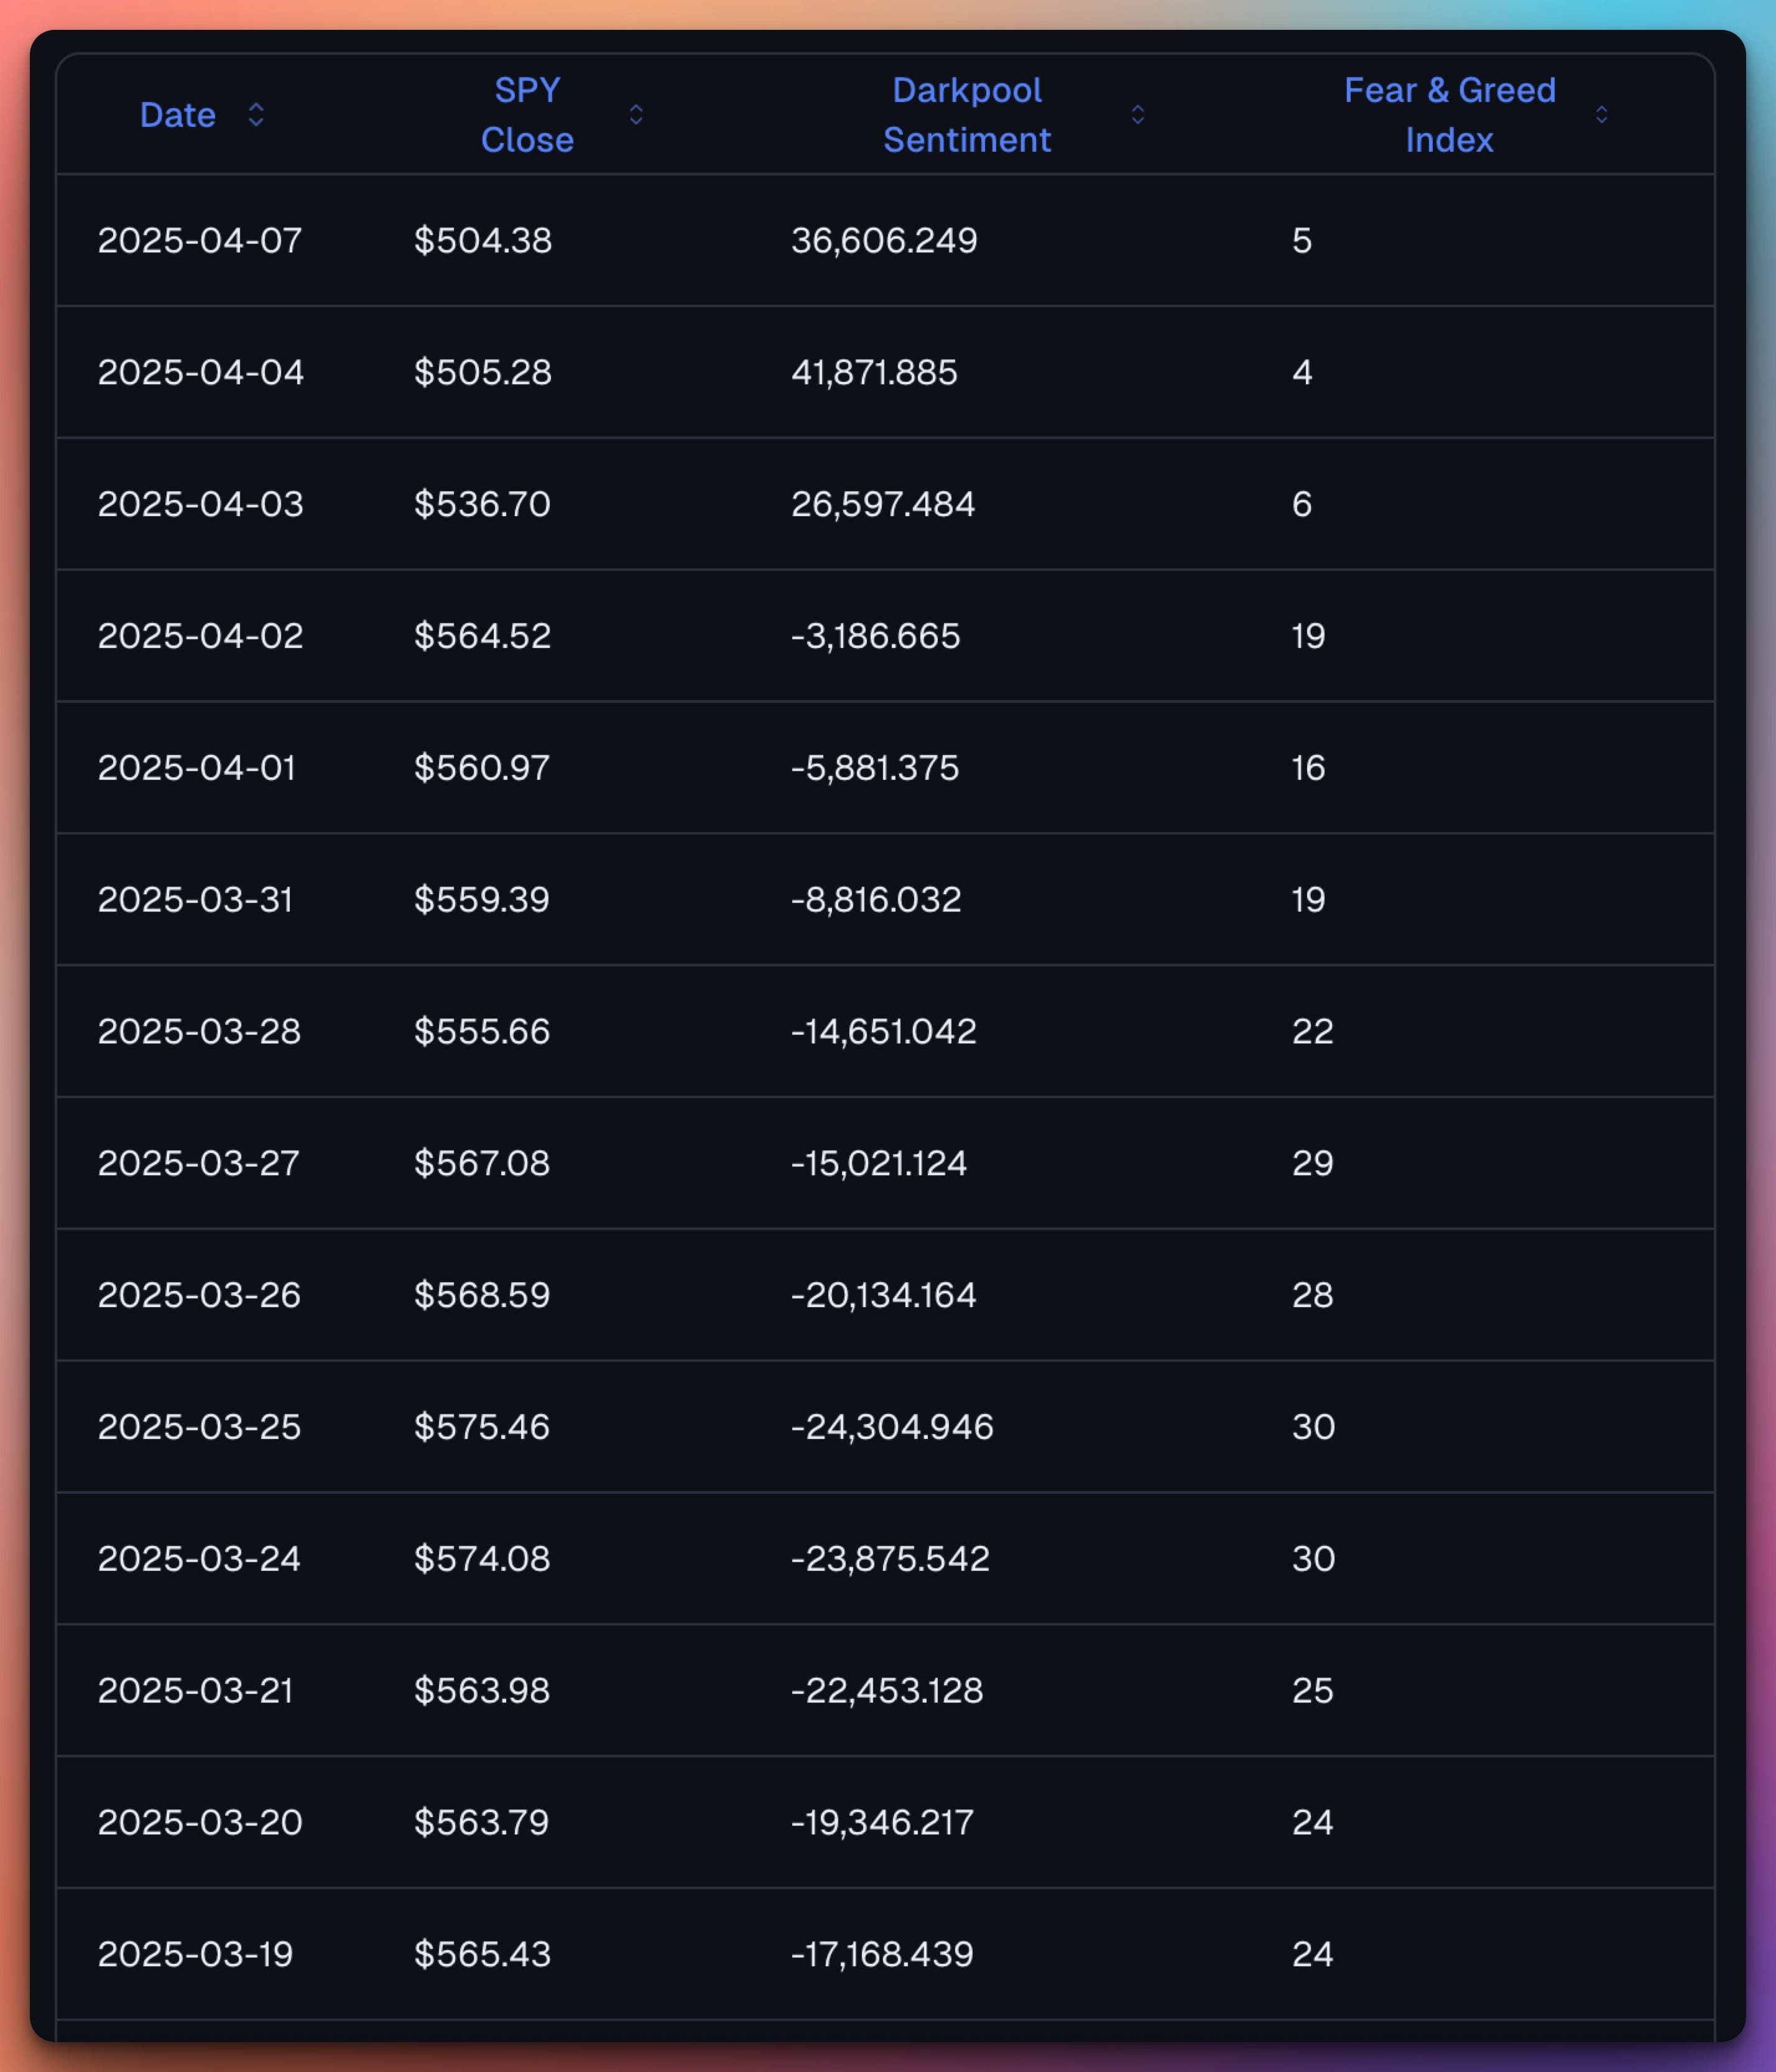
Facebook Prophet is reporting an 85% correlation on institutional dark pool option trades on SPY and SPY crashes.
And it’s happening again today:
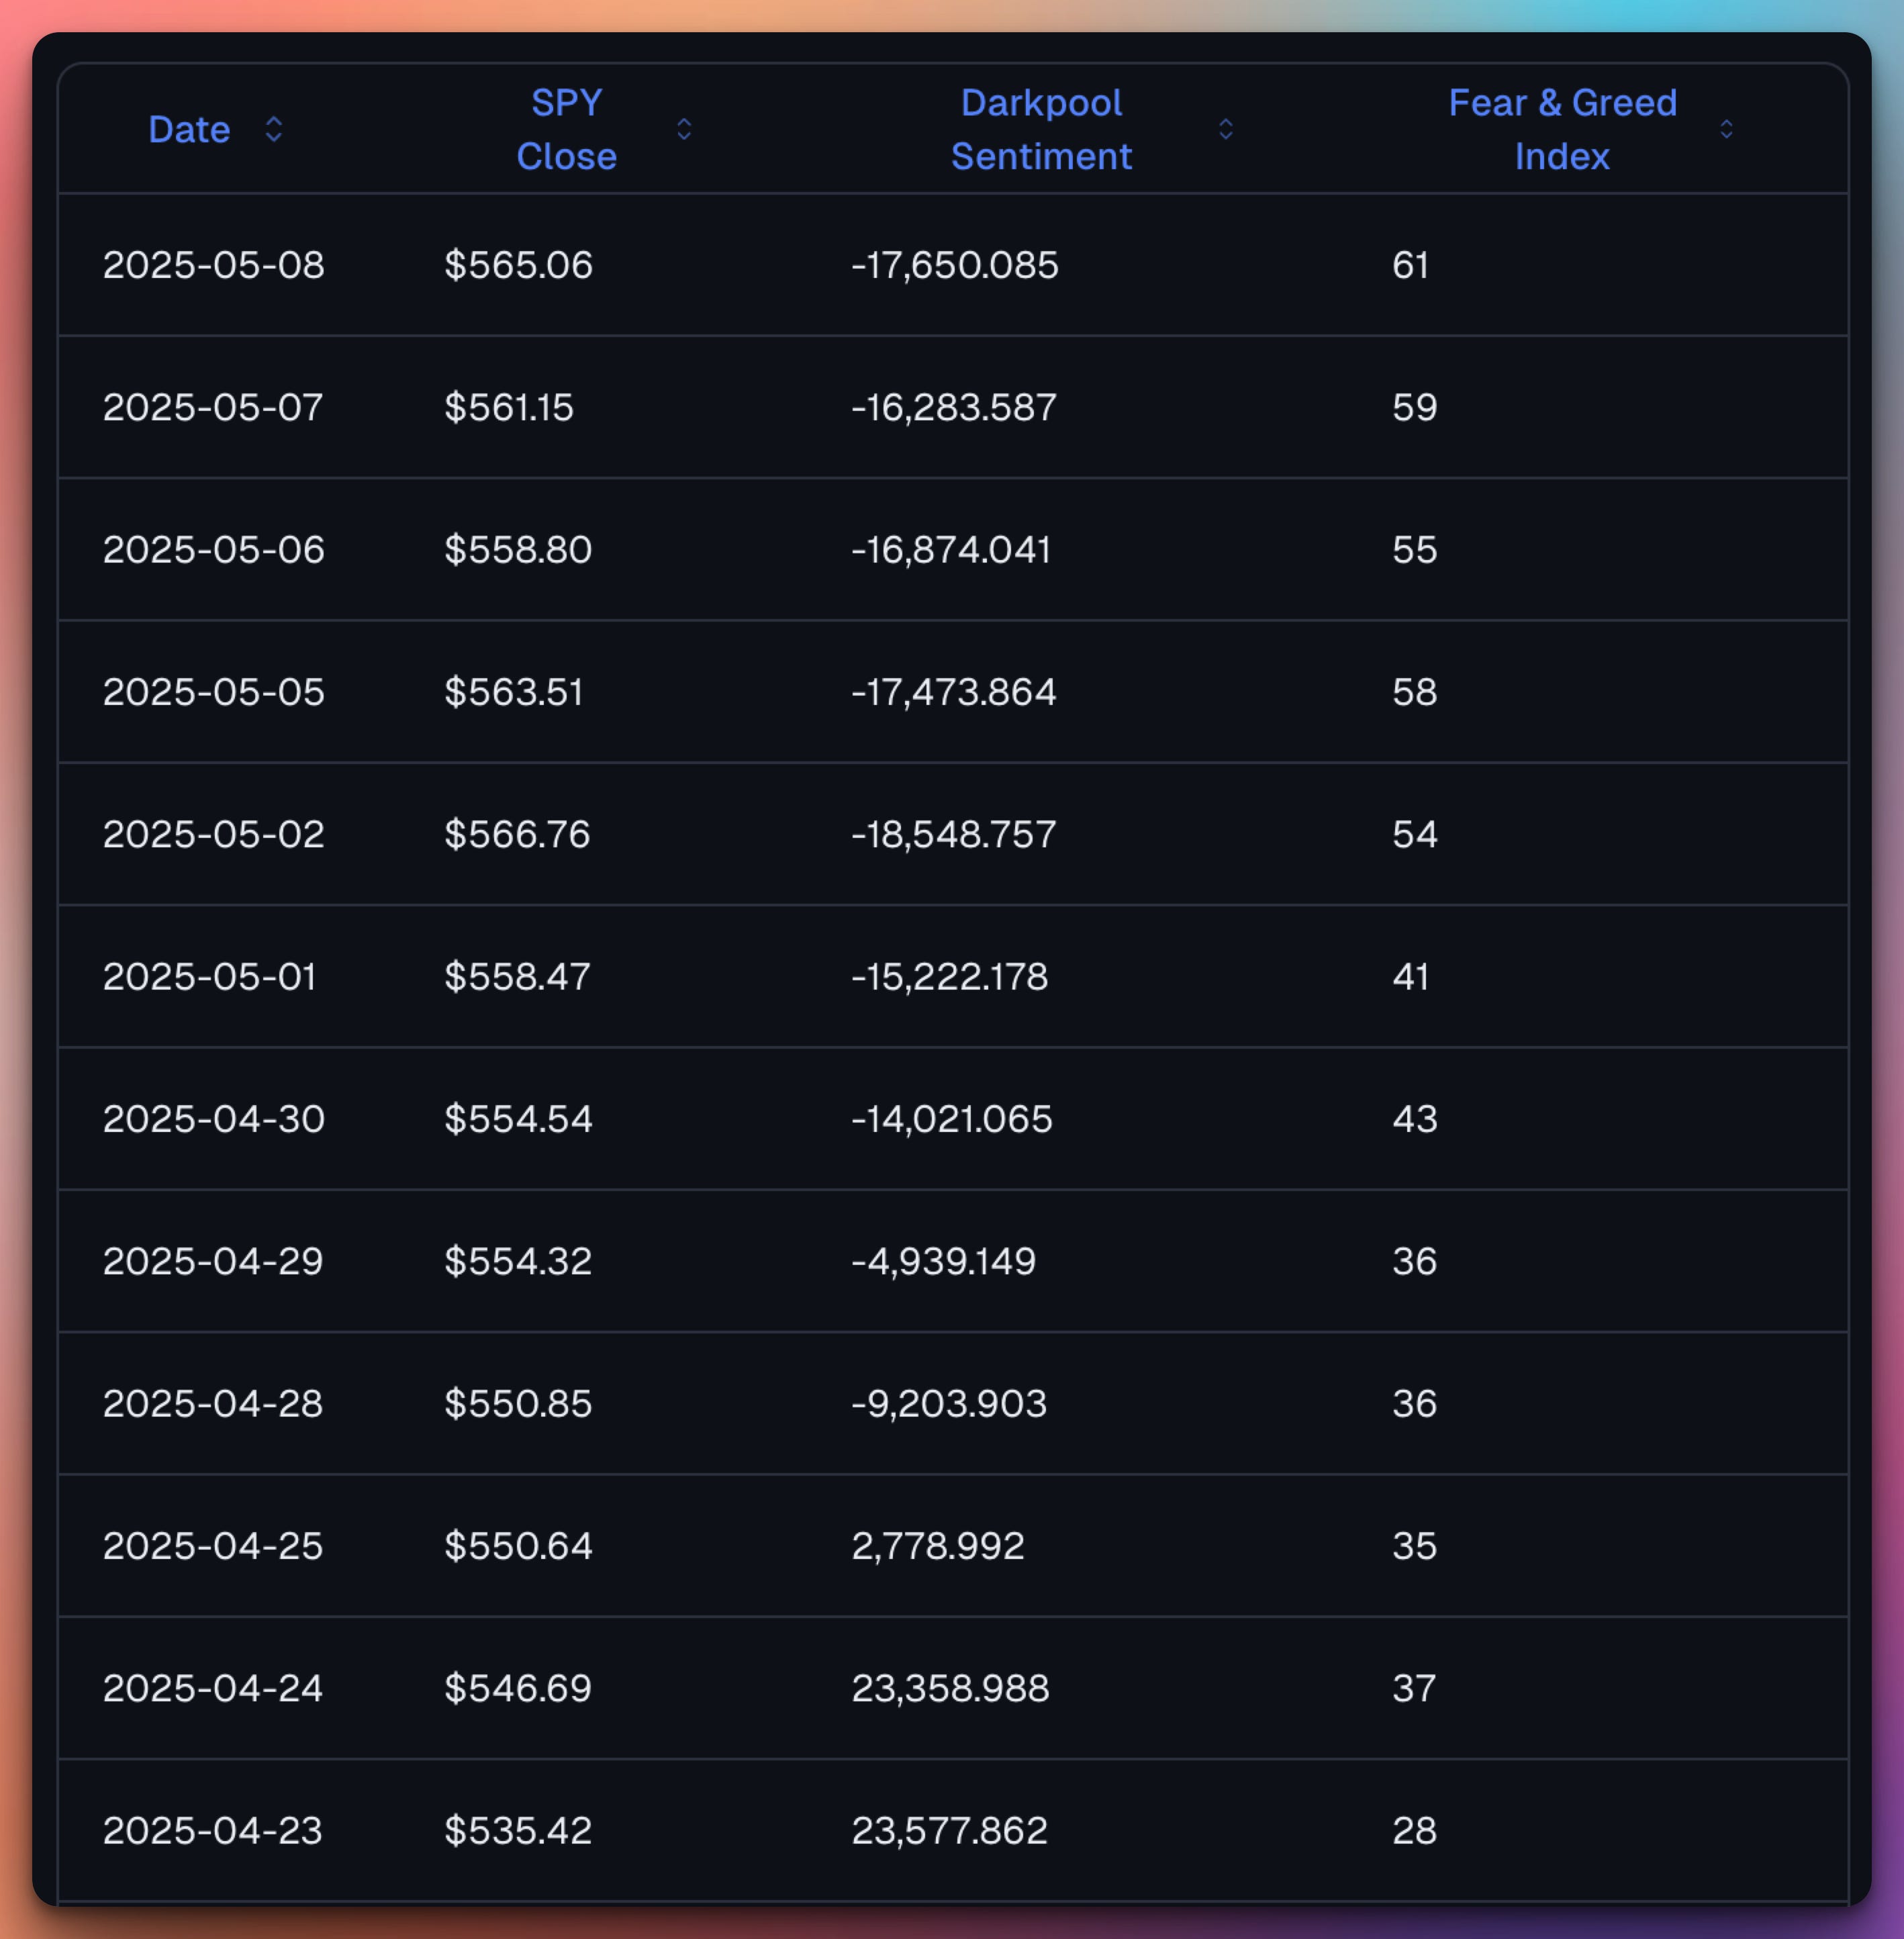
This is priceless information.
I moved my money into T-bills and made money instead of losing 15% and panicking.
I also coded this in chart form:
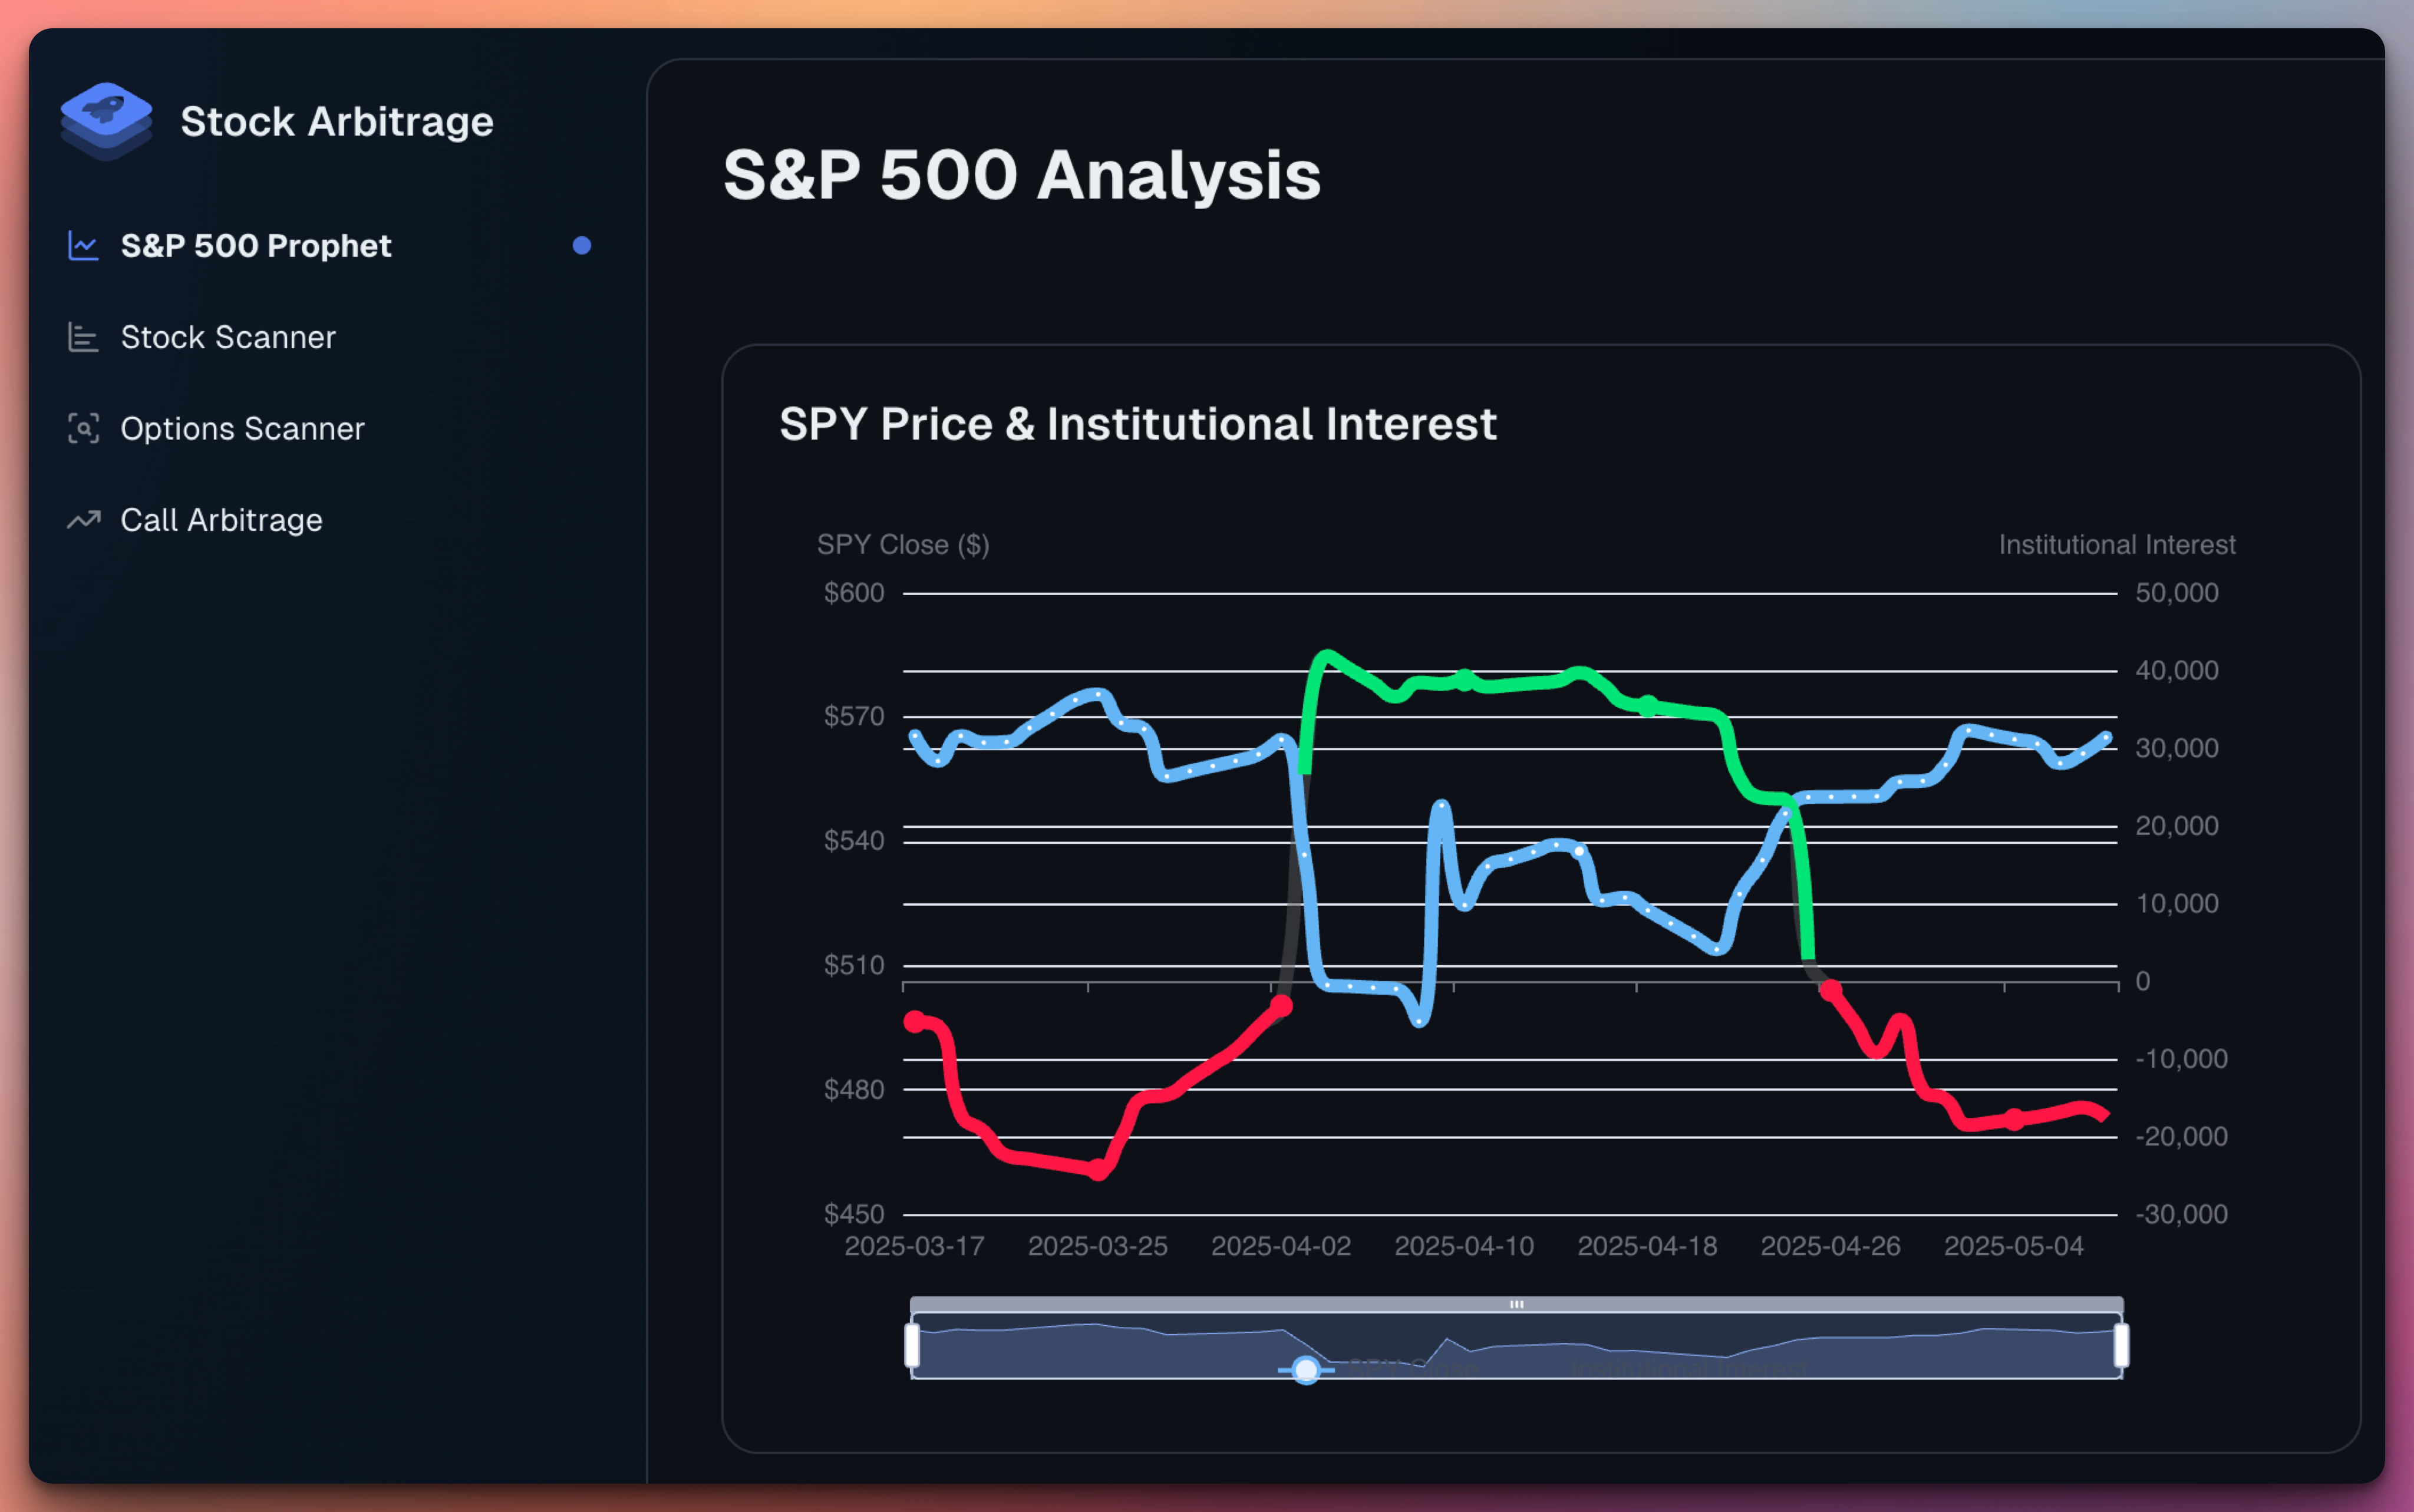
The blue line is the price of SPY.
The red and green lines represent institutional option flow on SPY.
In the right column, you can see the 0 value of Institutional Interest, and it clearly correlates with what is happening to SPY.
Institutions buy options days and weeks out, which is why this indicator is leading by a week or two. This is great for us because we can anticipate what will happen.
What Is Coming Up Soon:
The data will be updated after every trading day.
This app will be the core of my offering. Much more flexible than Telegram signals.
For the next few weeks, an entirely new tool will be released inside the app every week until we cover everything you need.
I’m gathering all the historical data, and we will analyze the recommendations' results and adapt to make the algorithm even better — the Quantum Genetic Engine I developed.
Exact entry and exit points for stocks for all kinds of traders are coming next week.
I wish you well, my friends,
Jack
This is great stuff but I have a question about your statement: "My algorithm made 2,118.39% over the same time period. Starting with $100k, ending with $2,218,388.24"
Which algorithm are you referring to specifically? is it the roshi indicator? Is this SPY equity trading, individual stock, or is it option trading? What are the specific buy/sell indicators that got you 2118% in the back test? Can we see that data? How many trades were there per day/week/etc. 21x is obviously crazy good, but I'd like to know more about it in order to judge it and hopefully put it into play in the future
Great work, Jack. Thanks for your effort with this + the efforts of those who helped with the testing, etc. It’s really appreciated.