


⭐️ Week 14, 2025: MASSIVE $7 Trillion Loss to Investors in 2 Days
Recession or an Opportunity?


To Smart Investors,
The Important Really Stuff:
This is the last time I’ll write a marketing piece like that. We don’t need more members at this point, as the platform is growing organically.
Jack:
If everything goes according to plan, my new website will be online tomorrow, and the revolutionary stock scanner will be up on Tuesday or Wednesday.
What is have created is essentially a tier-1 institutional trading option/stock analysis tool that is normally reserved for the big boys in Chicago.
Look up these terms: Sweeps, Dark Pools, Whale Movements, Block Trades, Fourth Markets. I’m making all these extremely complex setups distilled into a workflow that will take a few hours a month and aiming to achieve 1-2%/day for everyone. No day trading is our rule. This is designed for people who have a 9-5.
This is your last chance to get the lifetime membership for The Stock Insider. After that the price goes up to $3k/year.
Once the site is up, I am disabling lifetimes.
People who signed up before, at any price, will have access to the highest tier of my future tools forever.
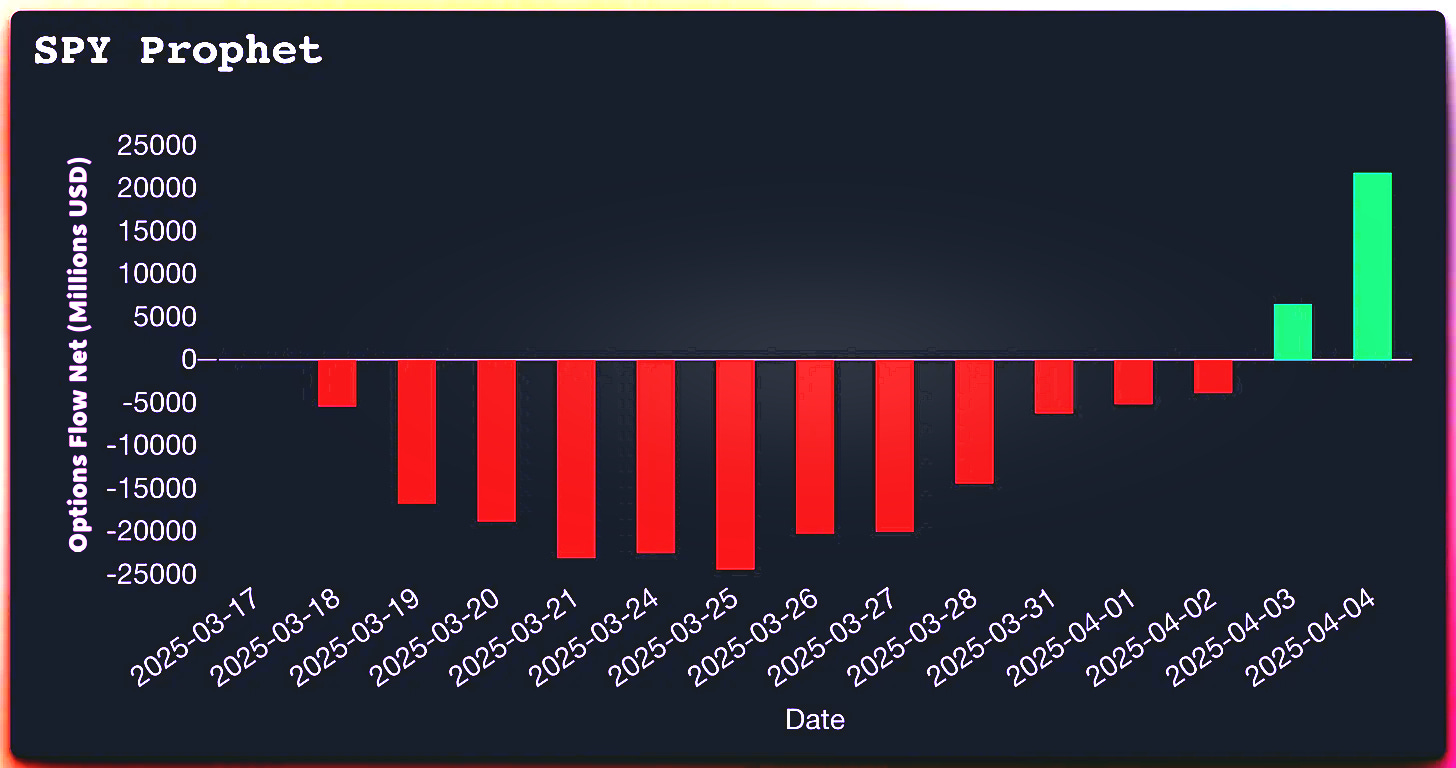
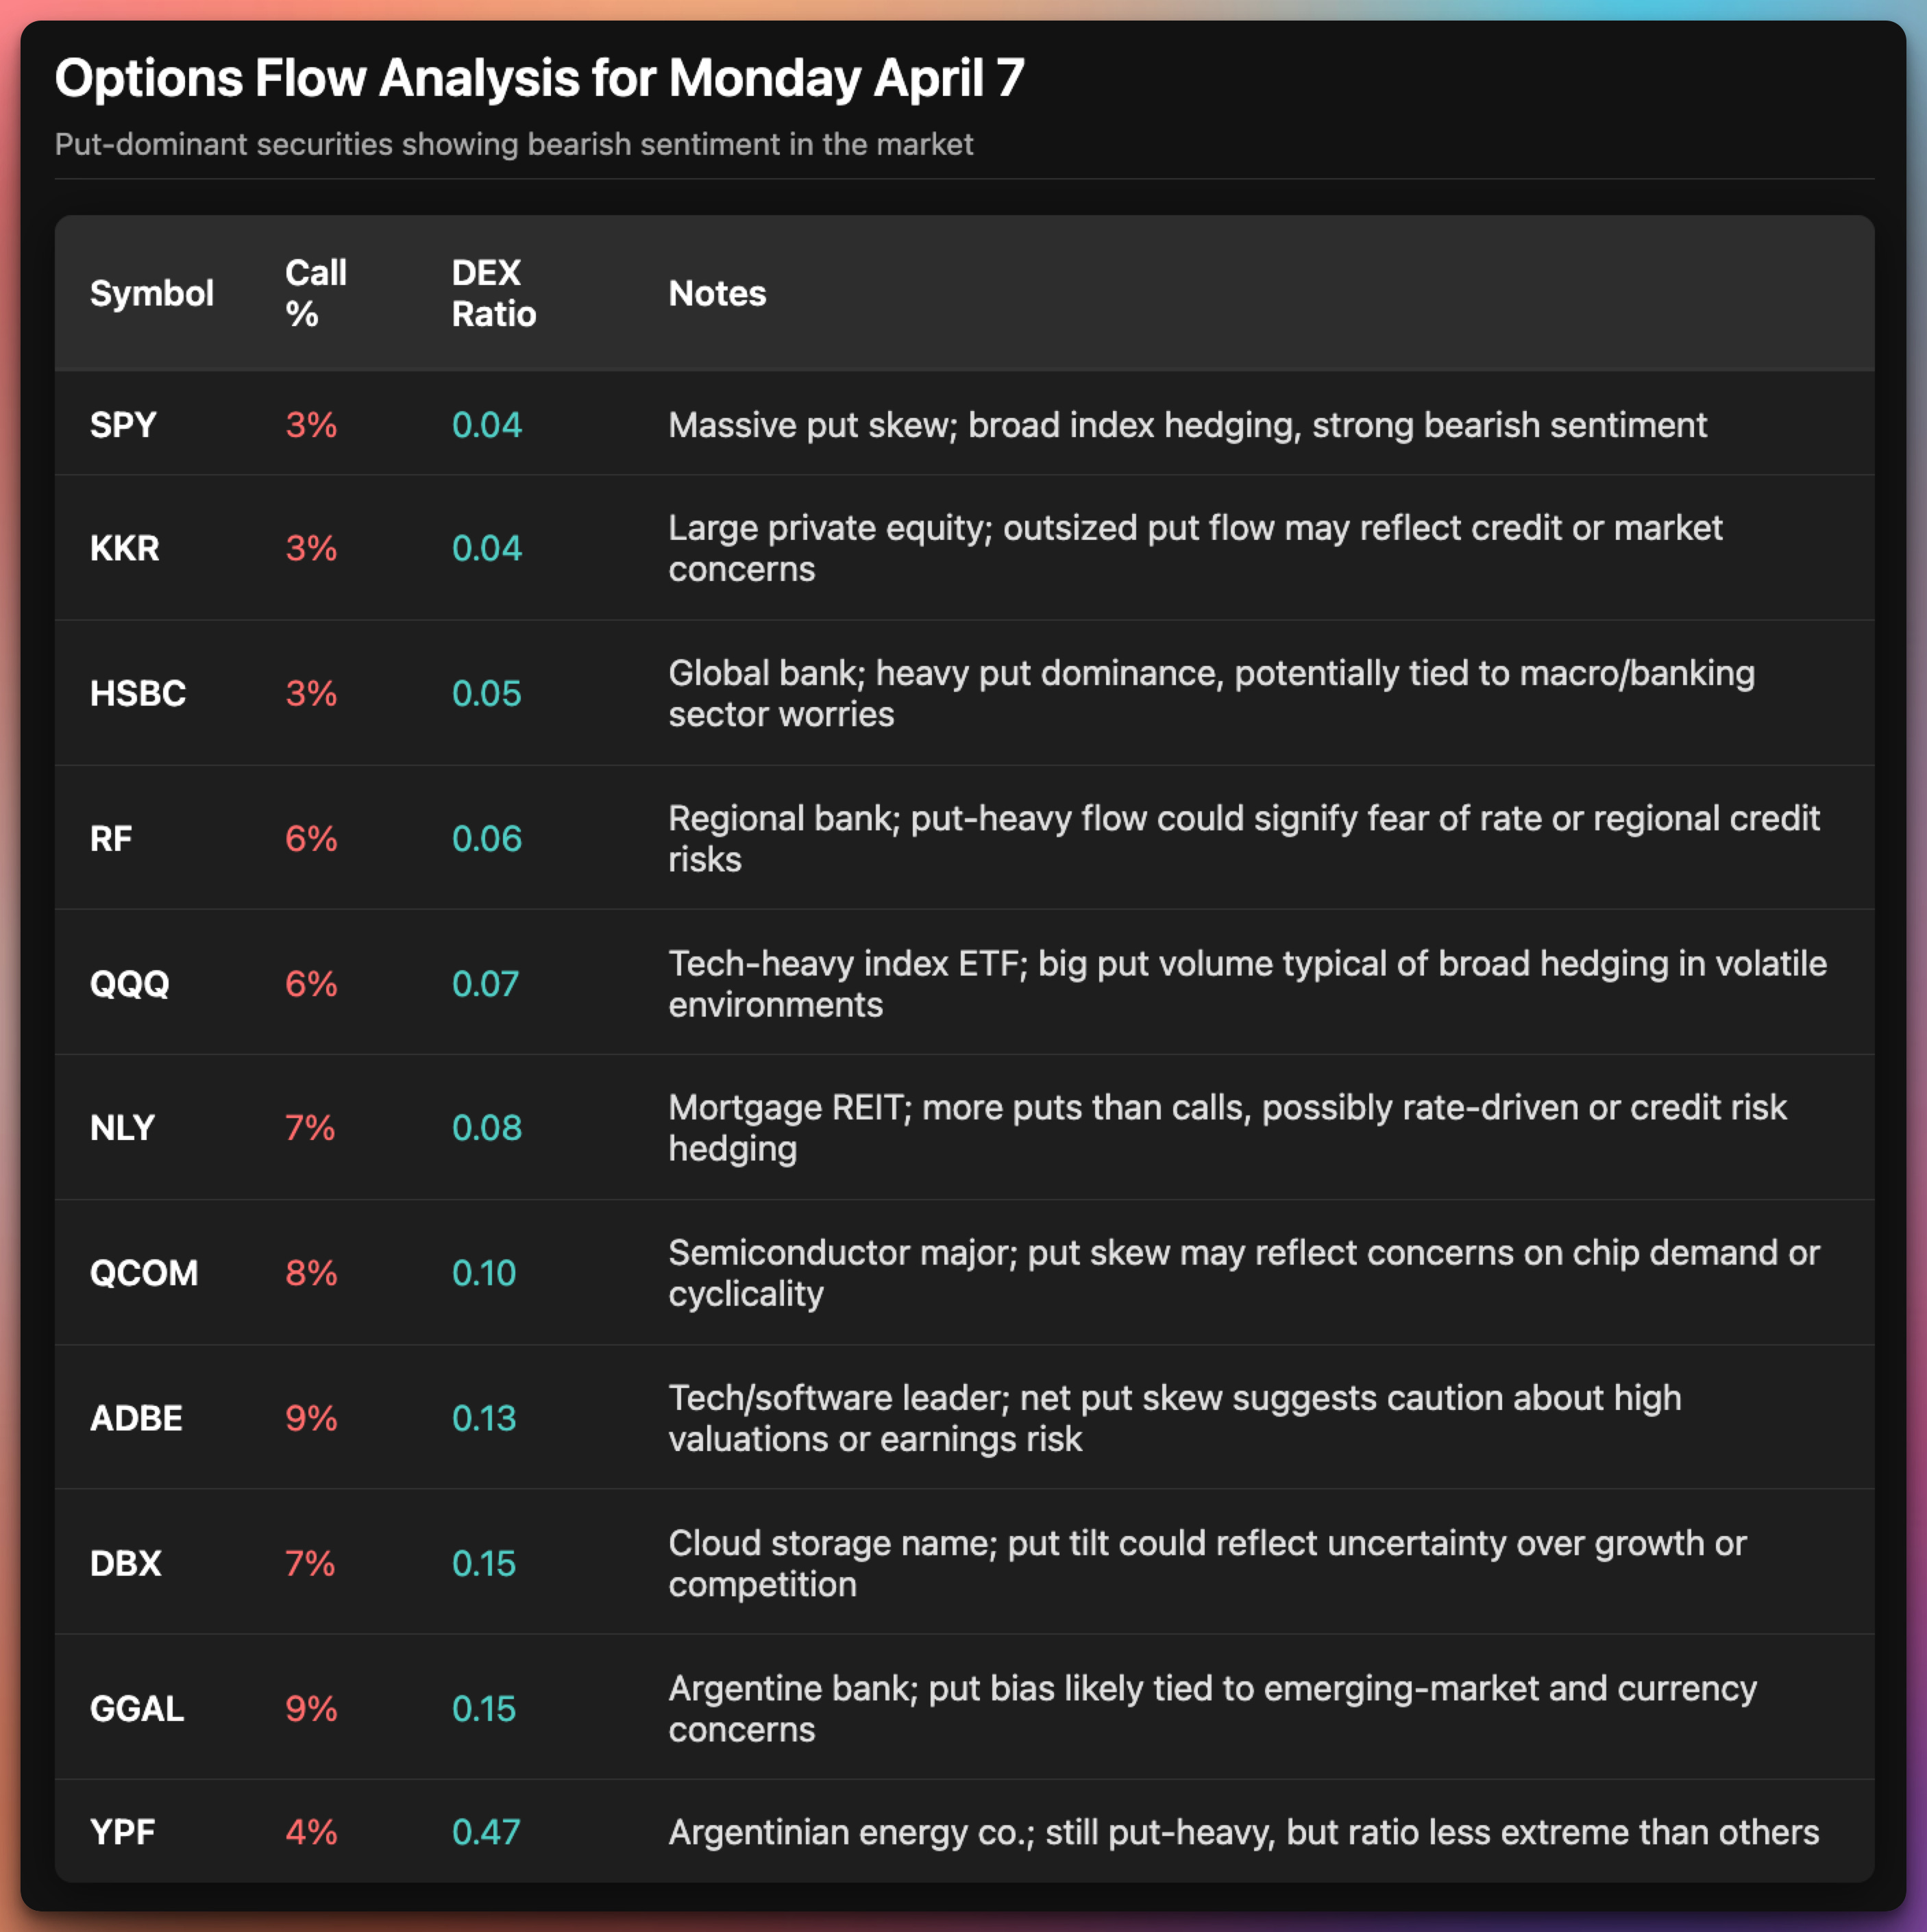
My Institutional Scanner predicted the market crash 2 weeks before it happened:
A sneak peek of the new website design:
The final scanner will include exact Entry Levels, Stop Losses, and Take Profits.
Longs, Shorts, Calls, and Puts as I finish coding the frontend over the next weeks.
That is exactly what I was doing at Knight Capital Group.
Get grandfathered in while you can here:
As always, no discounts. The price only goes up as I release new tools and eBooks.

All prior memberships include 3 new SaaS tools (an options scanner, an undervalued stocks detector based on fundamentals, and another secret tool), 10 eBooks, and more. These will be released over the next 12 months. The books are already written and are being edited by a NY Times Best Seller editor.
THIS JUST IN: Not only you will get all of the above if you sign up in the next 48 hours, you will have access to the Business Tier of my Stock scanner that will be priced at $2.5k/month or more.

Listen to today’s free weekly Podcast here:


Stuff We Published Last Week:


As Always In The Sunday Report:
I have written a detailed recap of last week’s market, my predictions for next week, and an ELI5 (Explain Me Like I’m 5).
You can also find my typical quant data and the stock insiders’ significant buys/sells with my interpretation.
Every day, I post summaries of news relevant to Investors. I try to post about 30 minutes before the markets open and cover the last 24 hours of news. On the weekends, I post in the afternoon.

Use the SECRET CODE to get my daily news newsletter/podcast for just $1/month or $10/year.
$51 lifetime plan is available for the next 48 hours and is going away forever.
This daily newsletter is read by decision-makers at companies ranging from Berkshire Hathaway, Citadel, and BlackRock, Inc. employees to the oil traders in the Emirates and Saudi Arabia and back to Alphabet in Mountain View, California, Apple, and NVIDIA.


S&P500 Heatmap over the last week
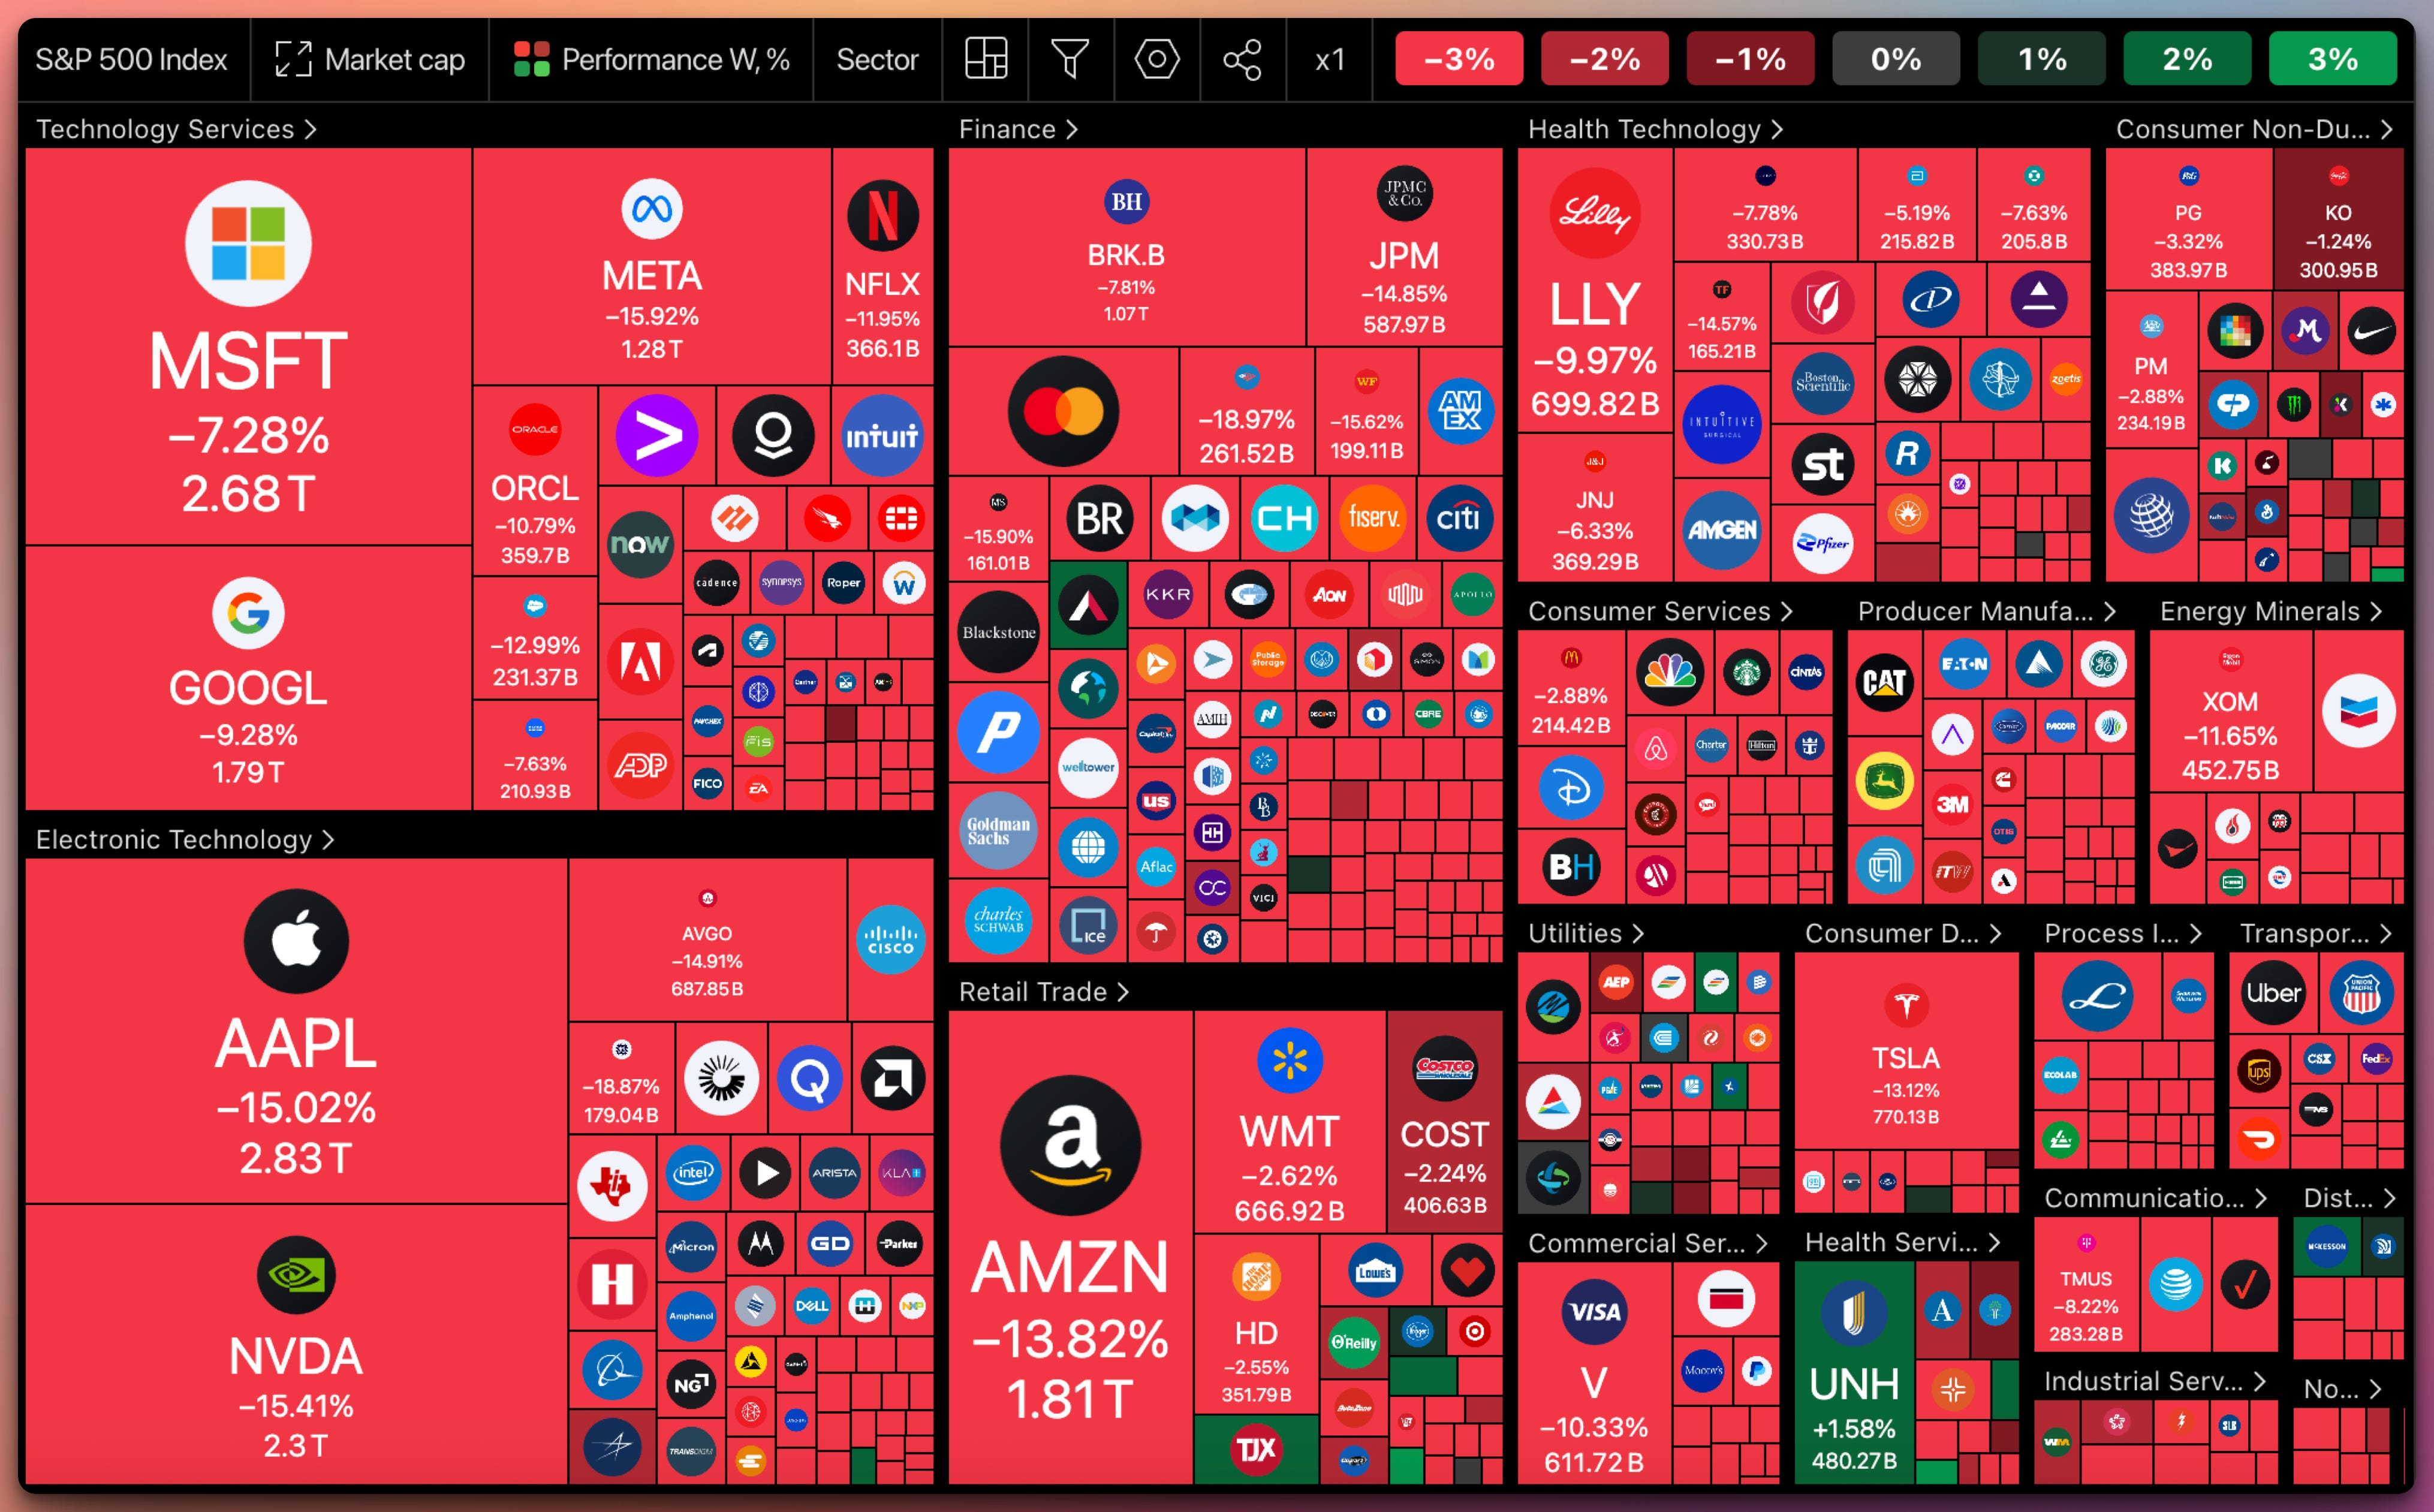
This graph was generated by our friends at TradingView. Did you know you can get 60% off the Premium plan forever, even though it's not Black Friday?

SPY Overview
Our friends at TradingView generated these graphs. Did you know you can get 60% off the Premium plan forever, even though it's not Black Friday?
*Also, the chart above shows precisely why you need the Premium TradingView plan in your life. Plus, being able to monitor 8 graphs simultaneously while running complex indicators on them in parallel. Look into this:
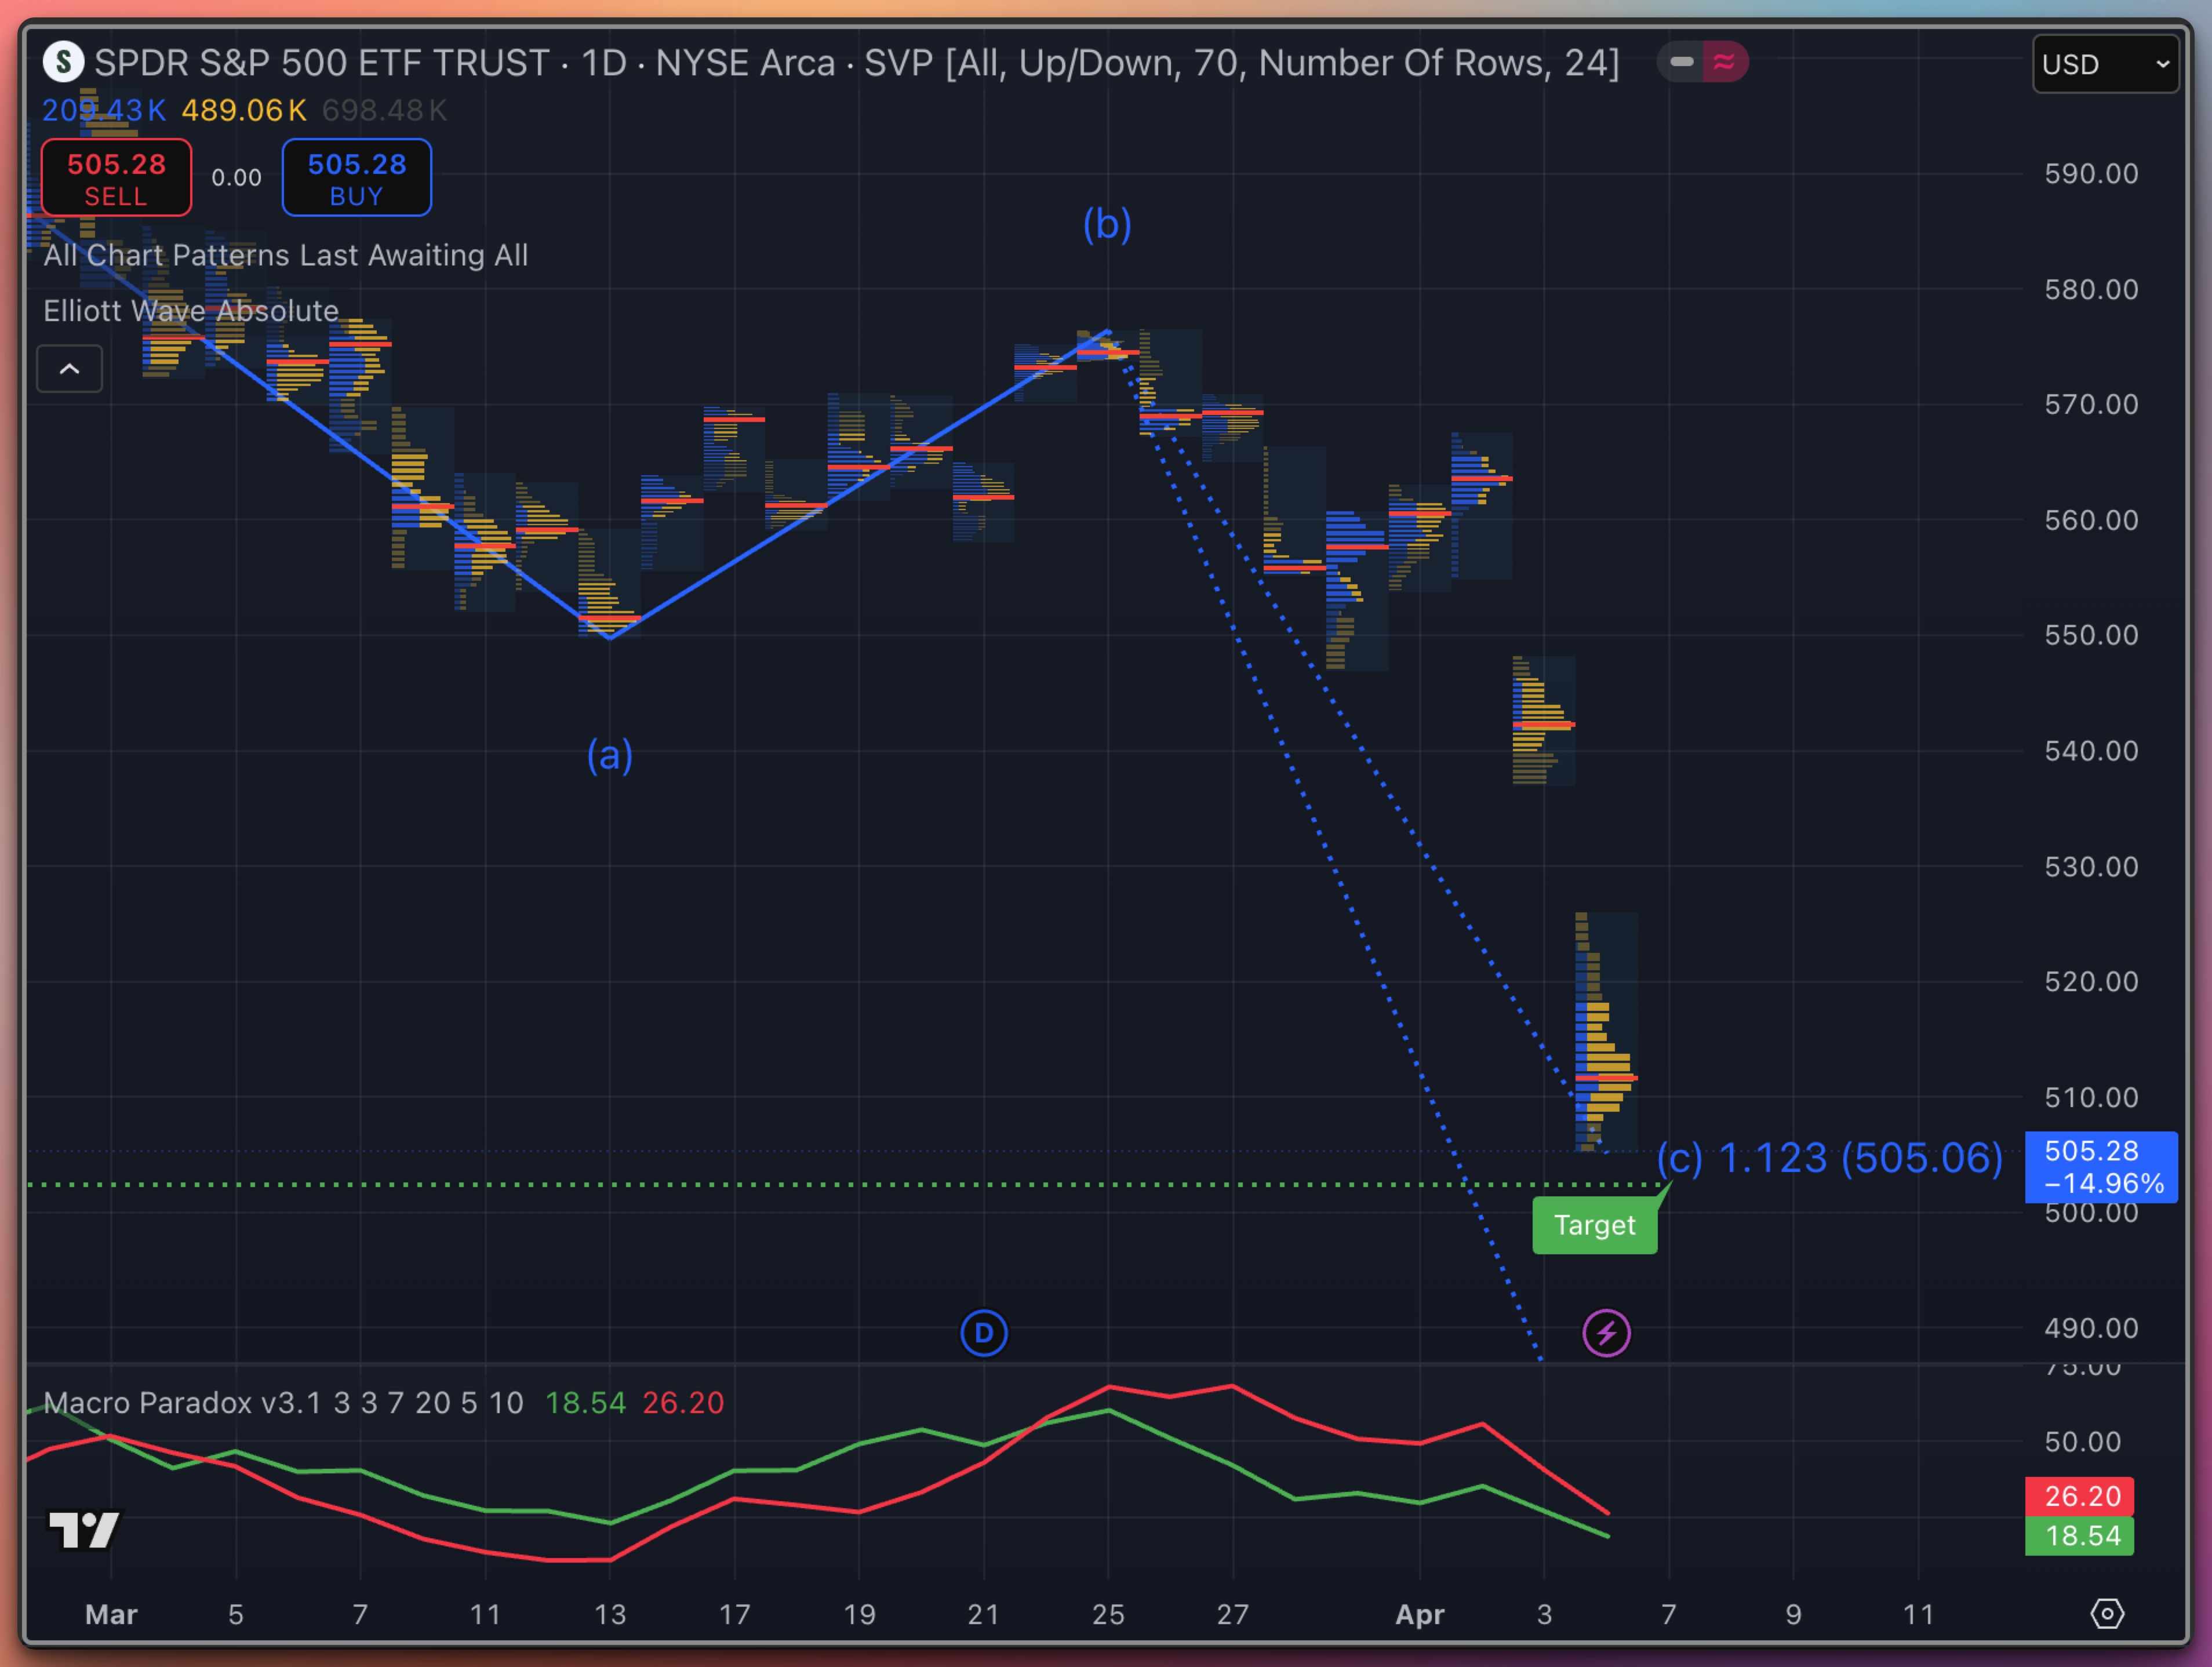
SPY Technical Snapshot
TL;DR: If we go below $500, we are screwed.
1. Elliott Wave & Price Structure
Wave (a) bottomed near the mid-510s.
Wave (b) retraced to the high-580s, forming a lower high on declining volume.
Wave (c) is in progress, targeting the 505 region (per the chart’s labeled “(c) 1.123”).
A decisive breakdown below ~505 can open the door toward 490–495 if selling pressure accelerates.
2. Volume Profile Analysis
There is a significant volume shelf around 500–505, implying strong interest and potential support.
Any close below this shelf on increased volume would likely confirm further bearish momentum.
3. Macro Paradox Indicator
Currently, the red line is elevated and trending higher while green is retreating.
This typically suggests bearish pressure for SPY over the next 2–7 days, aligning with the 70–80% historical accuracy of the tool.
Watch for a crossover (green reclaiming leadership) as a potential bullish shift signal.
4. Broader Market Context
Universal tariffs and retaliatory measures (notably China’s 34% tariff) have triggered risk-off sentiment, spiking volatility.
The historic April 4 market crash has further damaged confidence, intensifying recession fears and policy uncertainty.
Fed caution on rates, inflation risk, and hawkish trade rhetoric raise the probability of continued instability in the near term.
Bottom Line
Short term, 505 is the pivotal level. Should SPY defend that zone—and if Macro Paradox shifts to a green-led reading—expect a relief bounce toward 520–530. Failure to hold 505 likely sends SPY toward the mid- to upper-400s, especially given the deteriorating economic backdrop. Keep stops tight, watch the Macro Paradox for near-term signals, and prepare for elevated volatility as trade tensions deepen.
A Final Note: In this environment, demonstrating proactive risk management and an adaptable approach will be critical. Emphasize key technical inflection points and macro signals to show tangible progress and preparedness for further downside—or for sudden reversals—amid unprecedented market uncertainty. I’m excpecting a reversal in weeks, unless we cross that $500 resistance point hard.
Disclaimer: This analysis is purely educational and not financial advice. Always consider multiple factors and your own risk tolerance before making trading decisions.
*Macro Paradox is available for free here

Please send feedback and ideas using comments, PMs, or email. I answer all emails and PMs personally. There is no personal assistant BS here.
And, as always—stay informed—and do your own due diligence.
With every good wish, I remain
Yours sincerely in Christ,
Jack Roshi
Applied Mathematics Department, MIT
Lead Quant and Board Member, Alpha LLPOpinions are my own
Executive Summary of Last Week:
April 2025 saw unprecedented market volatility driven by sweeping U.S. tariff policies, global trade retaliation, and a historic stock market crash.
Key events include President Trump’s announcement of a universal 10% tariff (effective April 5) and escalated duties on countries such as China (34%) and the EU (20%), which immediately triggered sharp sell-offs in major U.S. indexes.
In just two trading sessions, roughly $6 trillion in market value evaporated, while recession probabilities spiked—with J.P. Morgan and Goldman Sachs revising their outlooks—and the Cboe Volatility Index surged to levels last seen in early 2020. Global responses ranged from retaliatory tariffs by China and Japan to aggressive shifts in bond yields and investor flight to safe-haven assets.
These events have set the stage for a challenging economic landscape and intensified uncertainty across markets.

Please subscribe to my Substack to access the premium report, which includes a comprehensive day‐by‐day breakdown, in‐depth weekly analysis, a list of the most shorted stocks, Excel spreadsheets of options flow, the most active stocks, projections for the next week, and insider trades and their interpretation.
Detailed Day-by-Day Analysis:
Keep reading with a 7-day free trial
Subscribe to The Stock Insider to keep reading this post and get 7 days of free access to the full post archives.