⭐️ Week 16, 2025: Countdown to a Profit Tornado
How the next semiconductor duty leak could slice tech another 7 %—and what to do before the bell
To Smart Investors,
The Most Important Stuff:
Jack’s notes for this week:
TradingView's Deal of the Year is here for the next 48 hours (actually less):
This is the best plan of the year, and the great thing is that you can stack it on top of your remaining days.
Pricing will vary by tier, your country, account reputation, and other factors, but the Premium plan should be 70% off for everyone, and the Ultimate plan should be 80% off.
Do this on desktop. For some people the discount doesn’t work at all, for reasons unknown.
Follow this link to get the deal.
It’s actually a better deal than the Black Friday deal.
I use TradingView for my actual trading because of their world-class implementation of Technical Indicators in C++.
We had some technical and real-life problems, but this week:
The Stock Scaner will be finally online.
I am dropping 2 eBooks. Available to all paying subscribers. Full-length, high-IQ books, edited by a NY Times bestseller professional. Not some AI-generated lead magnets.
In May, a third book is coming out — the first one in the series on Options. These will be complete gamechangers.
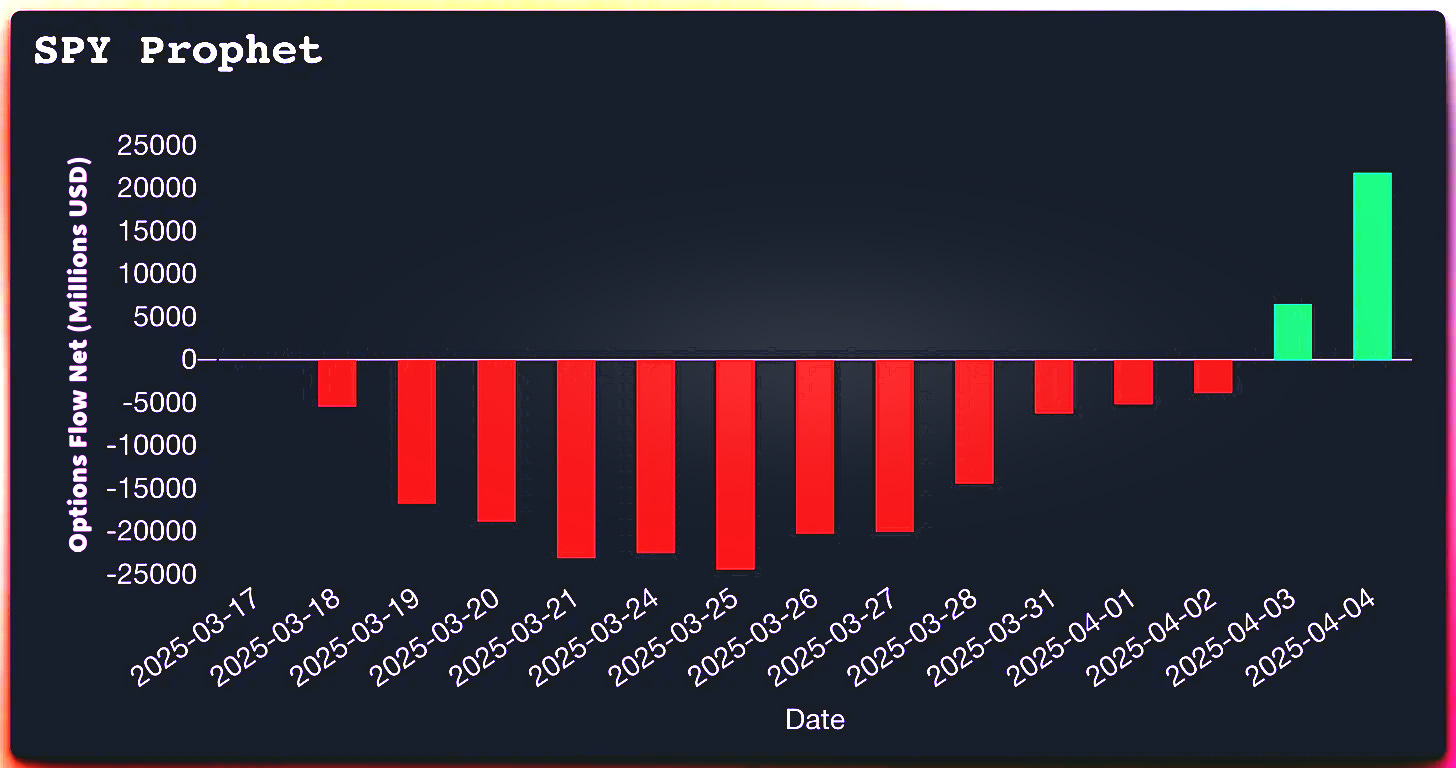
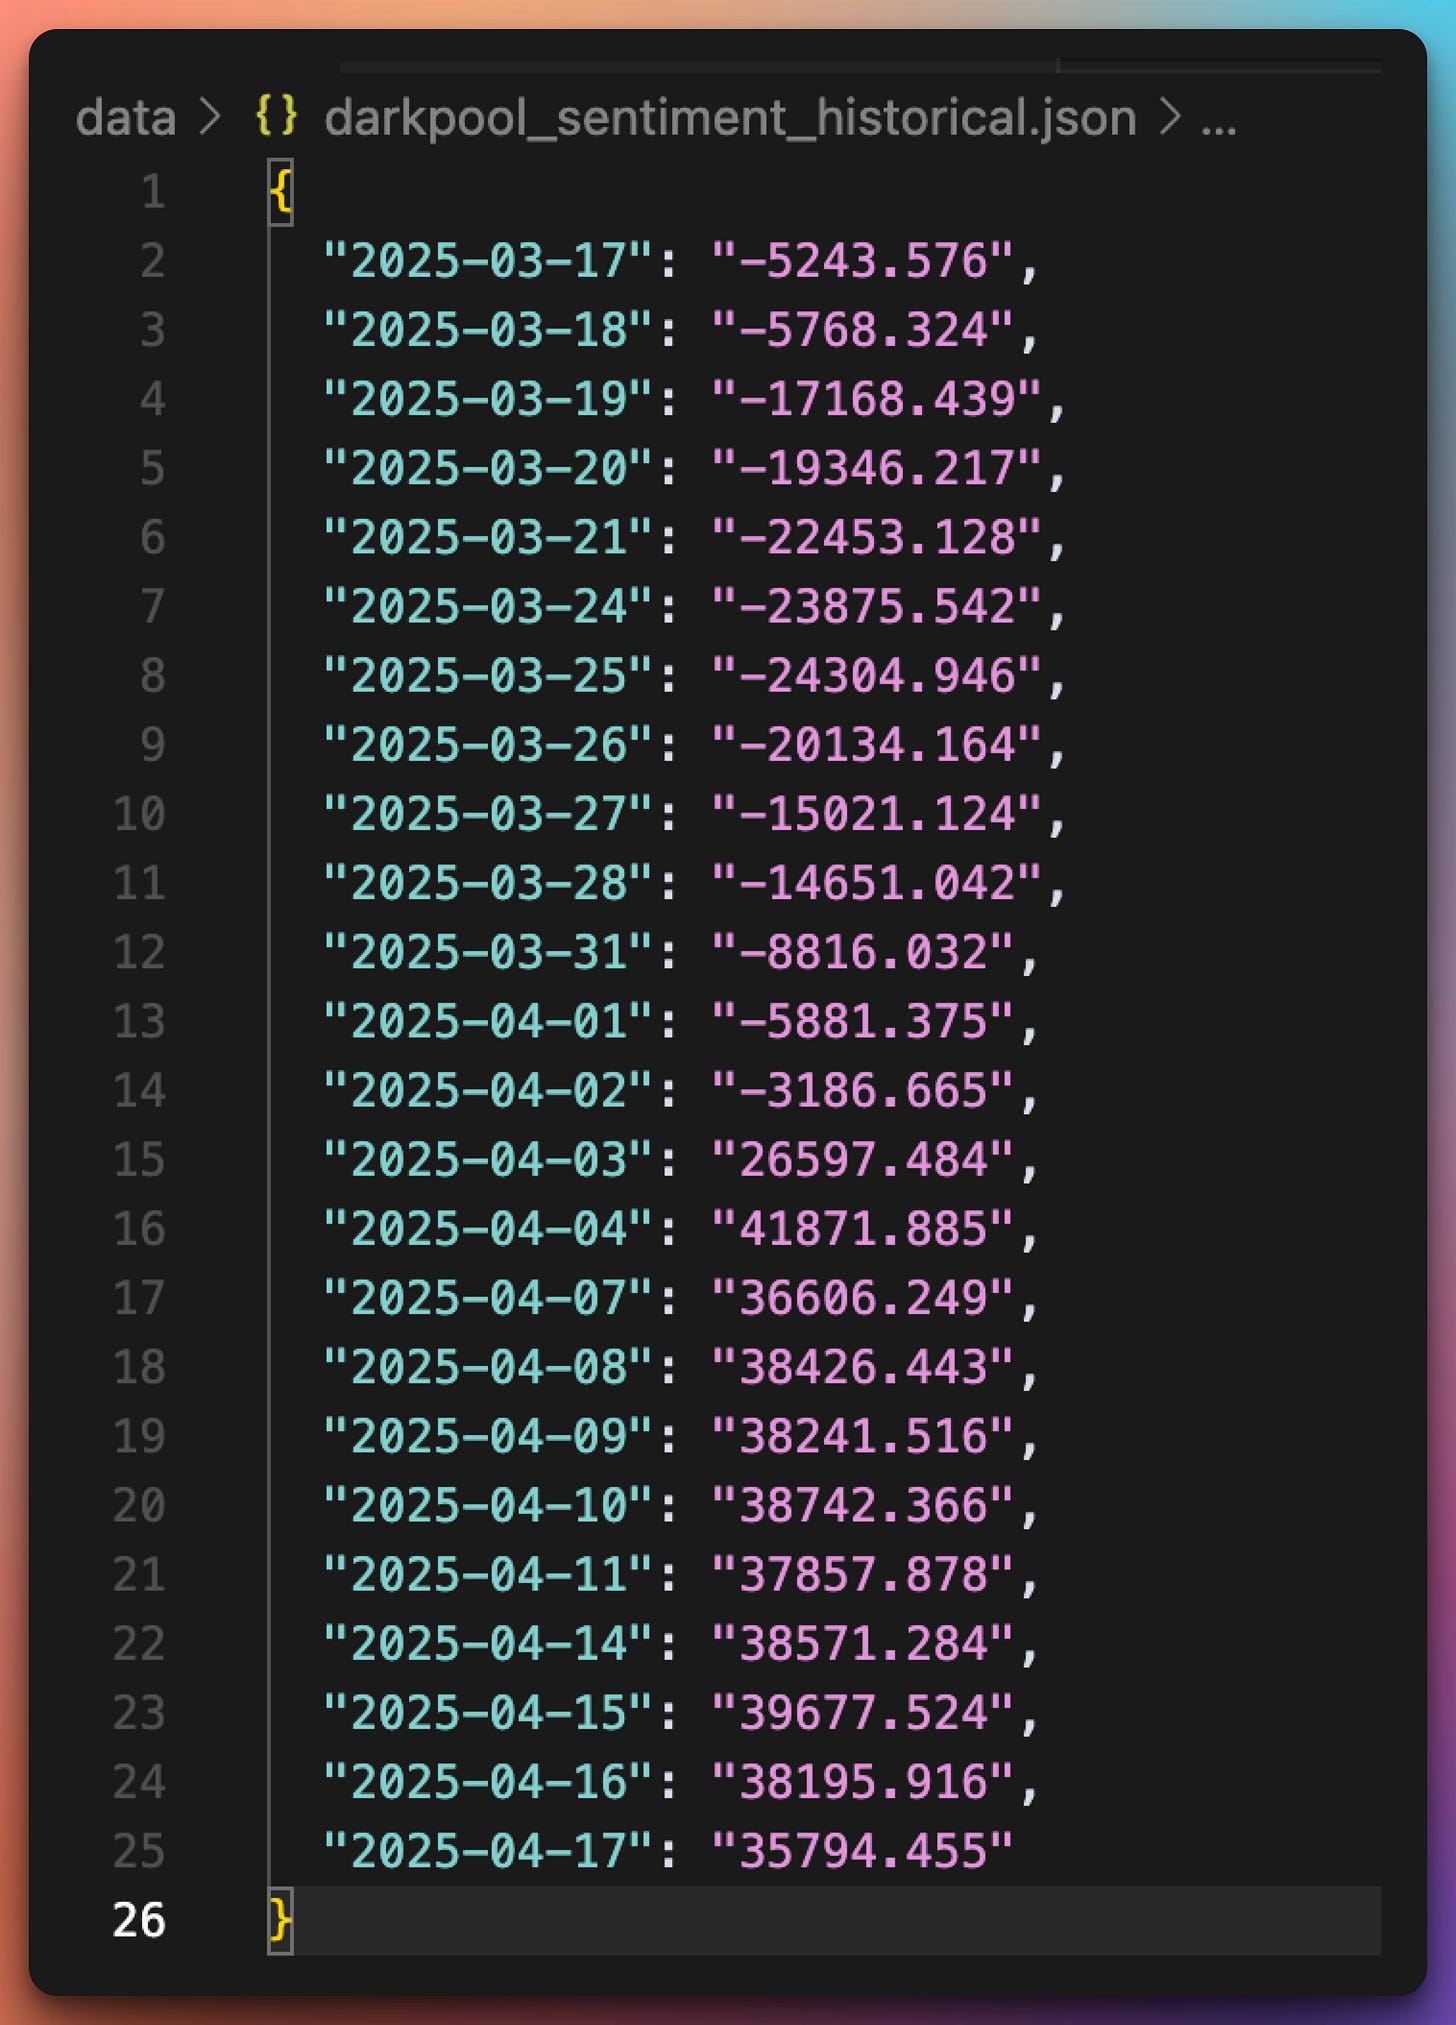
My Institutional Scanner predicted the market crash 2 weeks before it happened:
That is exactly what I was doing at Knight Capital Group.
This is what it is showing right now:
Get grandfathered in while you can here:
As always, no discounts. The price only goes up as I release new tools and eBooks.
All prior memberships include 3 new SaaS tools (an options scanner, an undervalued stocks detector based on fundamentals, and another secret tool), 10 eBooks, and more. These will be released over the next 12 months. The books are already written and are being edited by a NY Times Best Seller editor.
THIS JUST IN: Not only you will get all of the above if you sign up in the next 48 hours, you will have access to the Business Tier of my Stock scanner that will be priced at $2.5k/month or more.
Listen to today’s free weekly Podcast here:
Stuff We Published Last Week:
As Always In The Sunday Report:
I have written a detailed recap of last week’s market, my predictions for next week, and an ELI5 (Explain Me Like I’m 5).
You can also find my typical quant data and the stock insiders’ significant buys/sells with my interpretation.
Every day, I post summaries of news relevant to Investors. I try to post about 30 minutes before the markets open and cover the last 24 hours of news. On the weekends, I post in the afternoon.
This daily newsletter is read by decision-makers at companies ranging from Berkshire Hathaway, Citadel, and BlackRock, Inc. employees to the oil traders in the Emirates and Saudi Arabia and back to Alphabet in Mountain View, California, Apple, and NVIDIA.
These news are instrumental to my success.
$5/month — less than the cost of a Starbucks latte.
We recently crossed 1,000 paying subscribers 🙏🙏🙏
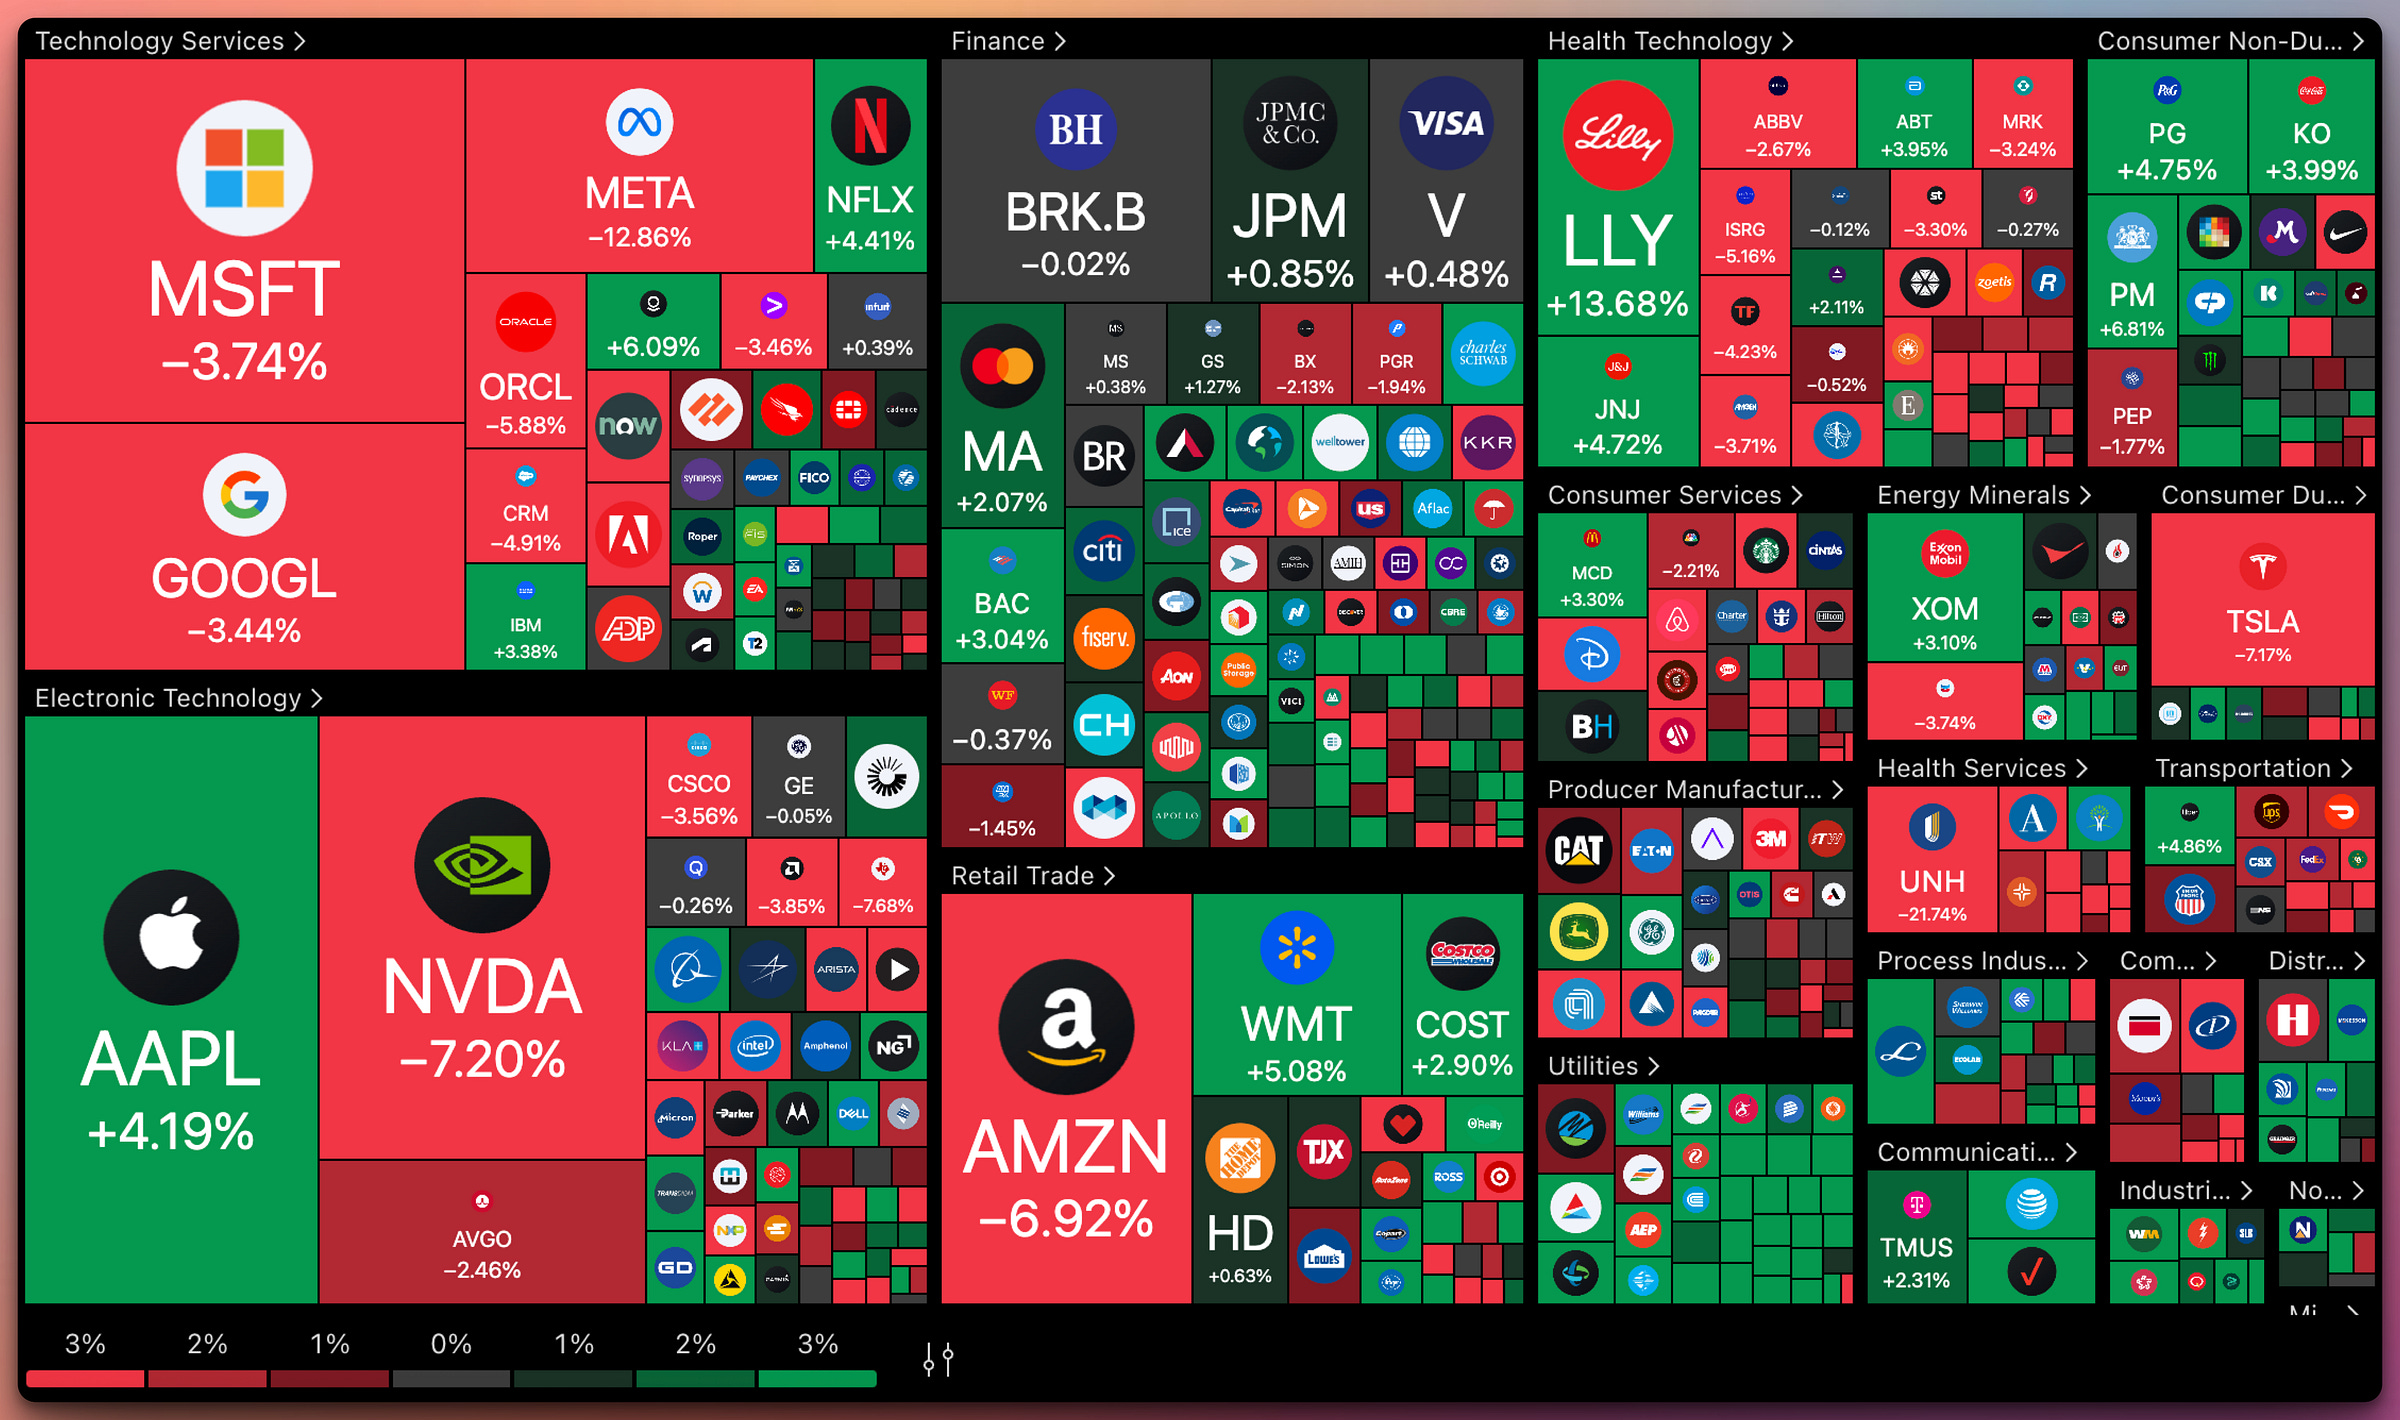
S&P500 Heatmap over the last week
This graph was generated by our friends at TradingView. Did you know you can get 60% off the Premium plan forever, even though it's not Black Friday?
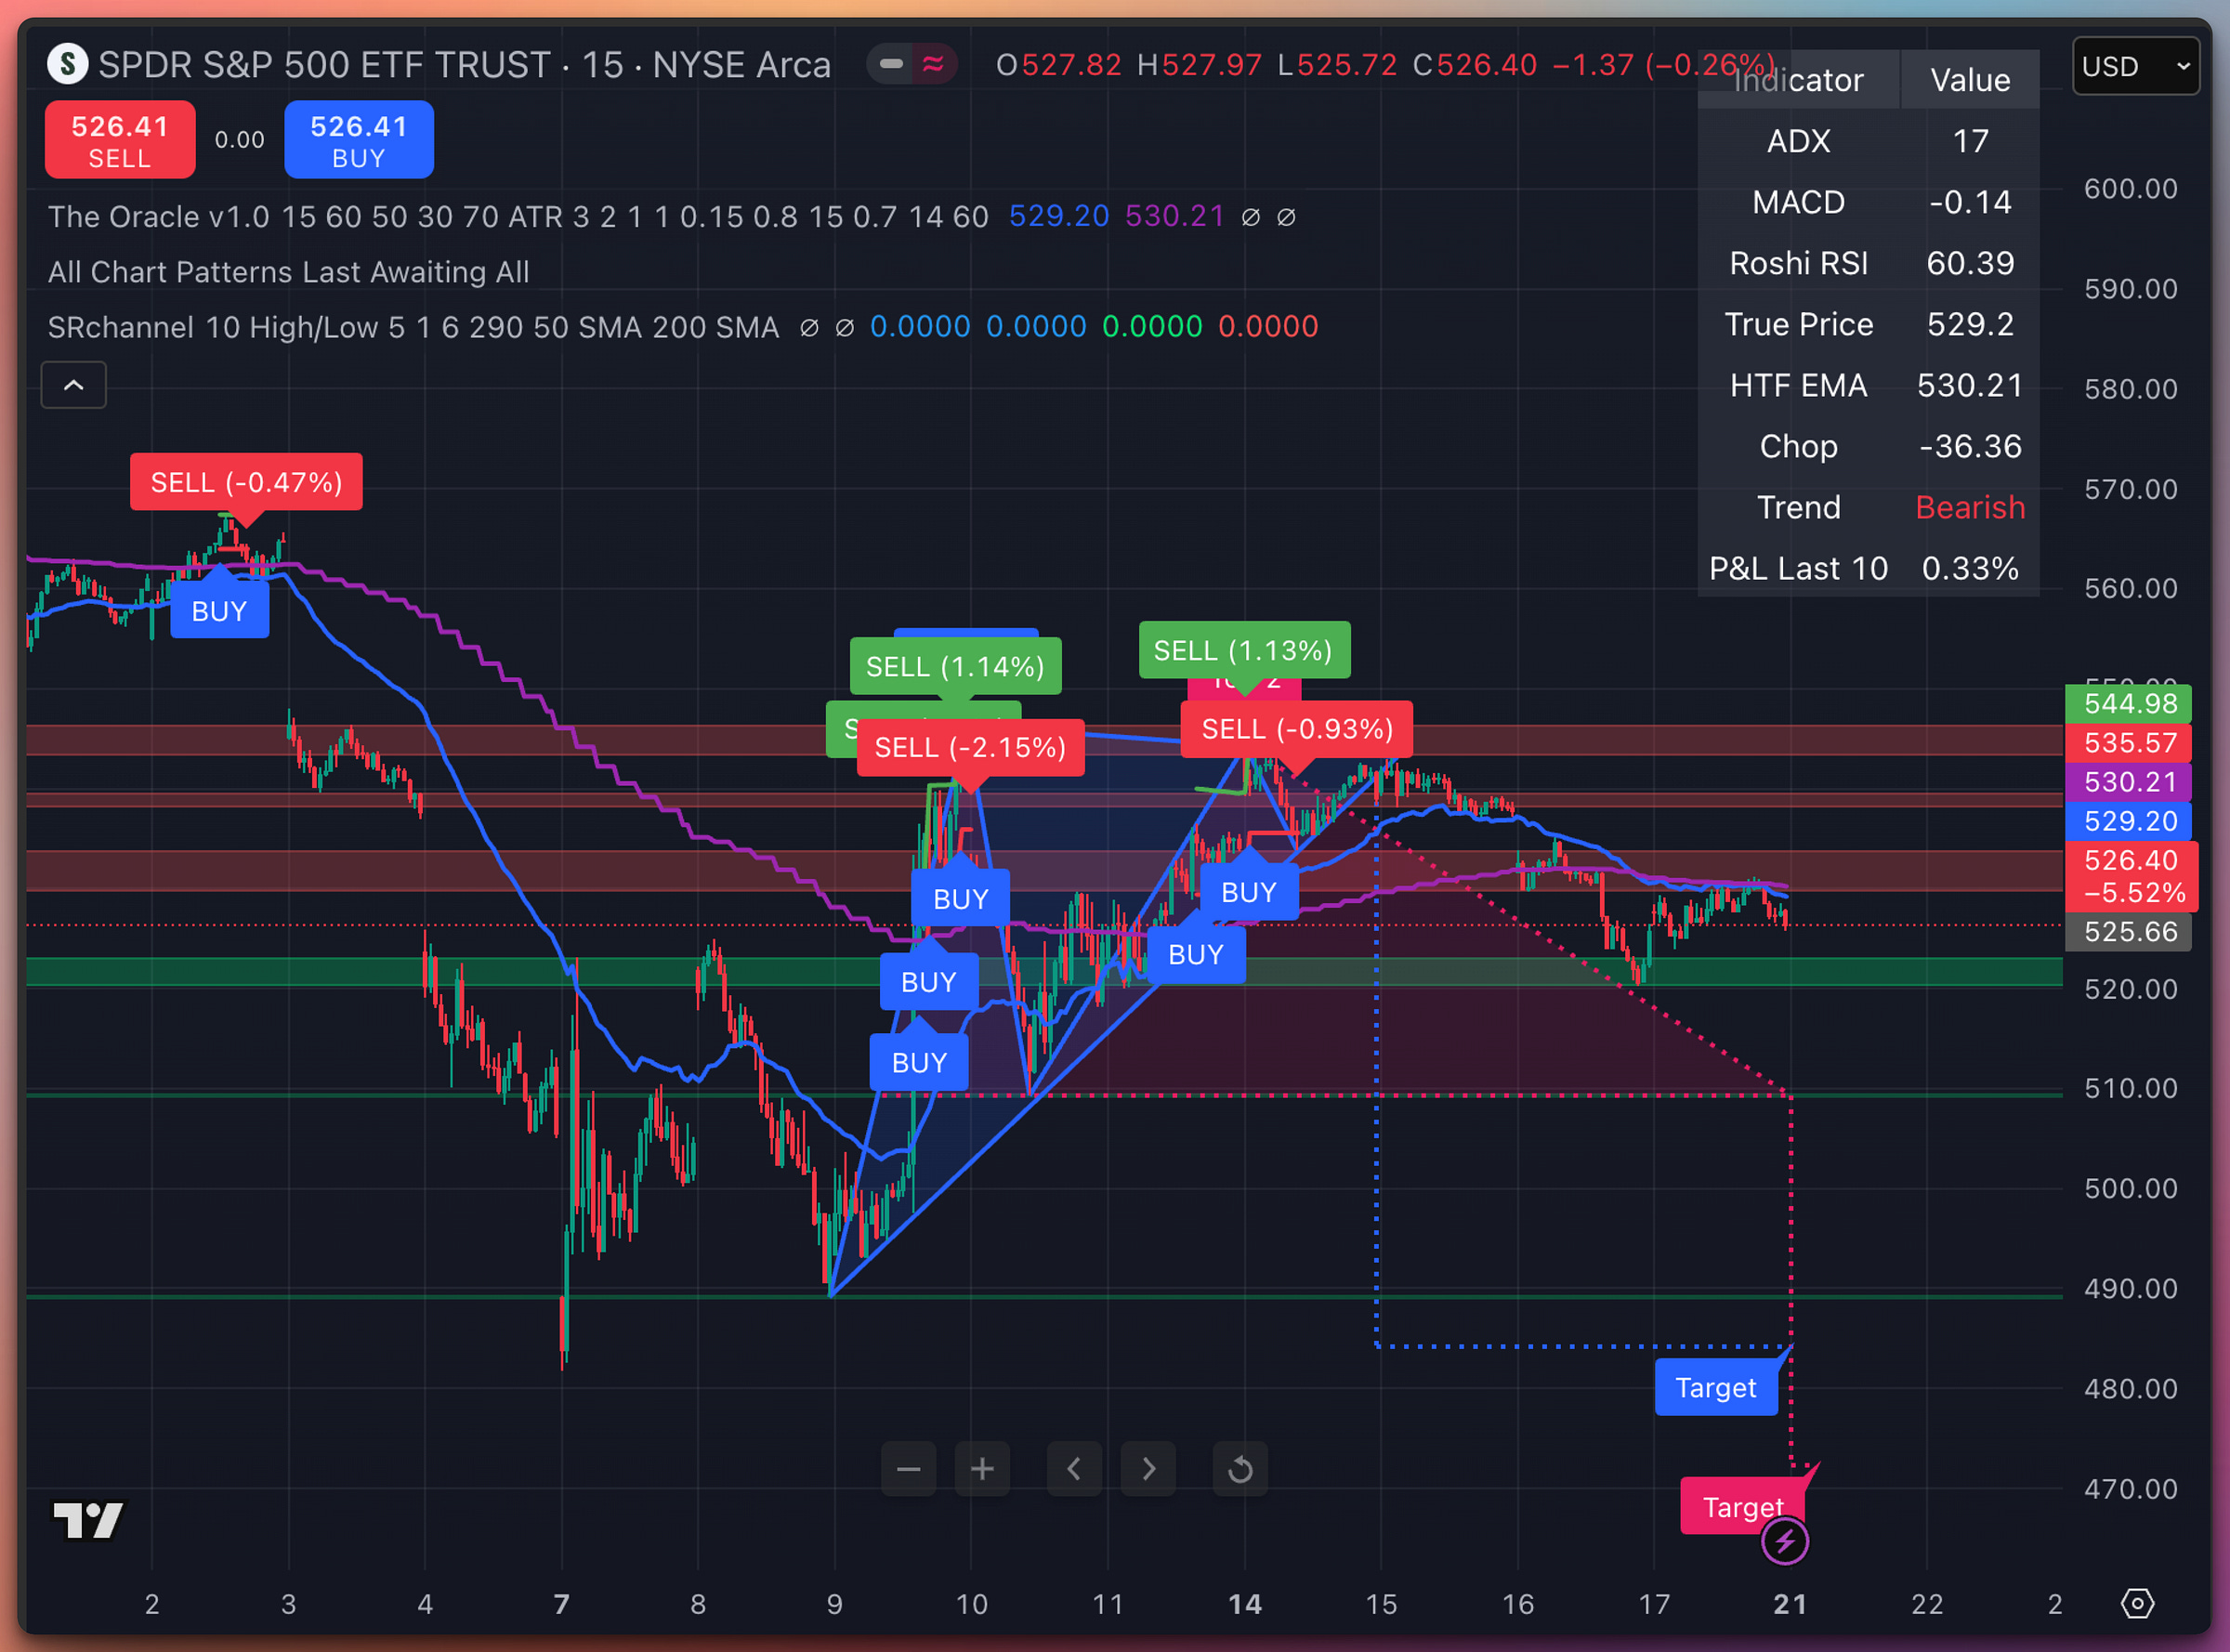
SPY
Our friends at TradingView generated these graphs. Did you know you can get 60% off the Premium plan forever, even though it's not Black Friday?
*Also, the chart above shows precisely why you need the Premium TradingView plan in your life. Plus, being able to monitor 8 graphs simultaneously while running complex indicators on them in parallel. Look into this:
SPY — 30‑Day Pulse Check
Last close: 526.41 on 17 Apr 25
Trend: Bearish across all relevant timeframes (price remains pinned under the high‑time‑frame 20‑EMA at 530.21).
Momentum: MACD is negative; ADX at 17 tells us the trend is just waking up.
Volatility: A chunky 11 % peak‑to‑trough range this month. One‑month IV sits at 23 % versus 21 % realised — convexity is still cheap.
What Blew Up the Party
Ascending wedge snapped. Buyers defended higher lows three times; on the fourth, liquidity vanished below 520.
Tariff whiplash. Monday’s exemptions delivered a sugar‑high; Section 232 probes plus Powell’s “tariffs tie our hands” remark cut the legs from tech mid‑week.
Rotation into safety. Gold burst past $3.3 k, the dollar dropped to a three‑year low, small‑caps eked out gains while mega‑caps bled. Early‑cycle stagflation vibes.
Tape Map (2‑ to 4‑Week Horizon)
Base‑case bleed (50 % probability)
Close below 520 and gravity drags us to 495‑490 (measured wedge target, roughly two ATRs).
Playbook: Keep gross light, run delta‑flat structures, harvest skew by selling 490‑480 puts.
Relief pop (30 % probability)
White House backs off tariffs or Powell blinks. Expect the rally to stall in the 535‑545 supply shelf.
Playbook: Fade strength with 40‑50‑delta calls, stop above 531.
Gap‑down flush (20 % probability)
Weekend tariff escalation or dismal mega‑cap earnings. Fast vacuum toward 475‑465 (weekly 200‑SMA and put‑gamma wall).
Playbook: Scale into core longs below 480, financed with cheap 470 puts.
Levels Worth Tattooing on Your Bloomberg
544.98 — month‑to‑date high, obvious supply shelf
535.57 — sellers re‑loaded after the wedge break
530.21 — high‑time‑frame 20‑EMA; reclaim neutralises the tape
520.66 — edge of the volume shelf; lose it and the air pocket begins
510.00 — round‑number sentiment line
490‑475 — option‑gamma pit plus weekly 200‑SMA
Positioning Crib‑Sheet
Dealer gamma flips net‑short below roughly 522, so intraday swings sharpen once that level gives way.
Breadth: only 55 % of S&P names sit above their 50‑day; if that slips under 50 %, 510 becomes the magnet.
Vol: Convexity remains under‑priced; buy insurance before the house catches fire.
Bottom Line
Unless SPY can close and hold above 530, the path of least resistance tilts lower. Size down, hoard dry powder, and remember: cash never draws down 30 %.
My shareholders want progress, not heroism.
Disclaimer: This analysis is purely educational and not financial advice. Always consider multiple factors and your own risk tolerance before making trading decisions.
*Macro Paradox is available for free here
Please send feedback and ideas using comments, PMs, or email. I answer all emails and PMs personally. There is no personal assistant BS here.
And, as always—stay informed—and do your own due diligence.
With every good wish, I remain
Yours sincerely in Christ,
Jack Roshi
Applied Mathematics Department, MIT
Lead Quant and Board Member, Alpha LLPOpinions are my own
Executive Summary of Last Week:
Week of April 14 – April 20, 2025
Markets lurched from euphoria to angst as the tariff roller‑coaster whipsawed pricing power without mercy.
Monday’s pop on Trump’s “temporary” electronics exemptions bled out by mid‑week after the administration opened Section 232 probes into chips and pharma, while Fed Chair Powell warned higher duties could handcuff policy.
Tech buckled (NVIDIA –6.3% pre‑market Wednesday) and mega‑caps dragged the S&P 500 to a –1.5% week, yet small‑caps squeezed out a gain and gold ripped above $3,300/oz.
Treasuries rallied on risk‑off demand, the dollar sagged to a three‑year low, and crude caught a bid on supply‑side chatter.
Bottom line: tariffs are now the single largest macro‑pricing engine; position size accordingly and keep dry powder for Sunday‑night gap risk.
Please subscribe to my Substack to access the premium report, which includes a comprehensive day‐by‐day breakdown, in‐depth weekly analysis, a list of the most shorted stocks, Excel spreadsheets of options flow, the most active stocks, projections for the next week, and insider trades and their interpretation.
Detailed Day-by-Day Analysis:
Keep reading with a 7-day free trial
Subscribe to The Stock Insider to keep reading this post and get 7 days of free access to the full post archives.


